The Four-Phase Engine ★
Consolidation → Expansion → Retracement → Reversal as one repeating cycle, each phase paired with exactly one reference point. The grammar of the whole system.
“They're not thirty patterns. They're four phases, and each phase has exactly one thing I look for.”
The verb you were never taught
You learned the nouns. Order block, breaker, mitigation block, FVG, liquidity void, liquidity pool, equilibrium, OTE, Judas swing, Asian range, killzone, SMT, turtle soup, PO3. About thirty of them, encountered as a flat list — which is exactly how 471 loose files present them.
A flat list of thirty objects has one predictable consequence: every chart looks like it contains all thirty at once. You can see six things and have no basis for choosing between them, so you either take the one that feels most familiar or you take nothing. That is not a knowledge problem. It is a missing organising principle, and it produces precisely the paralysis you have described.
Your library states the organising principle plainly. It is on the third slide of Month 1, and it is two short lists side by side.
A. Context or Framework surrounding the idea. 1) Expansion 2) Retracement 3) Reversal 4) Consolidation
B. Reference Points In Institutional Order Flow 1) Orderblocks 2) Fair Value Gaps & Liquidity Voids 3) Liquidity Pools & Stop Runs 4) Equilibrium
Two lists of four. Look at them for a moment before reading on, because the entire course turns on one observation about them: they are the same length, and they are in the same order. They are not two independent lists. They are a mapping.
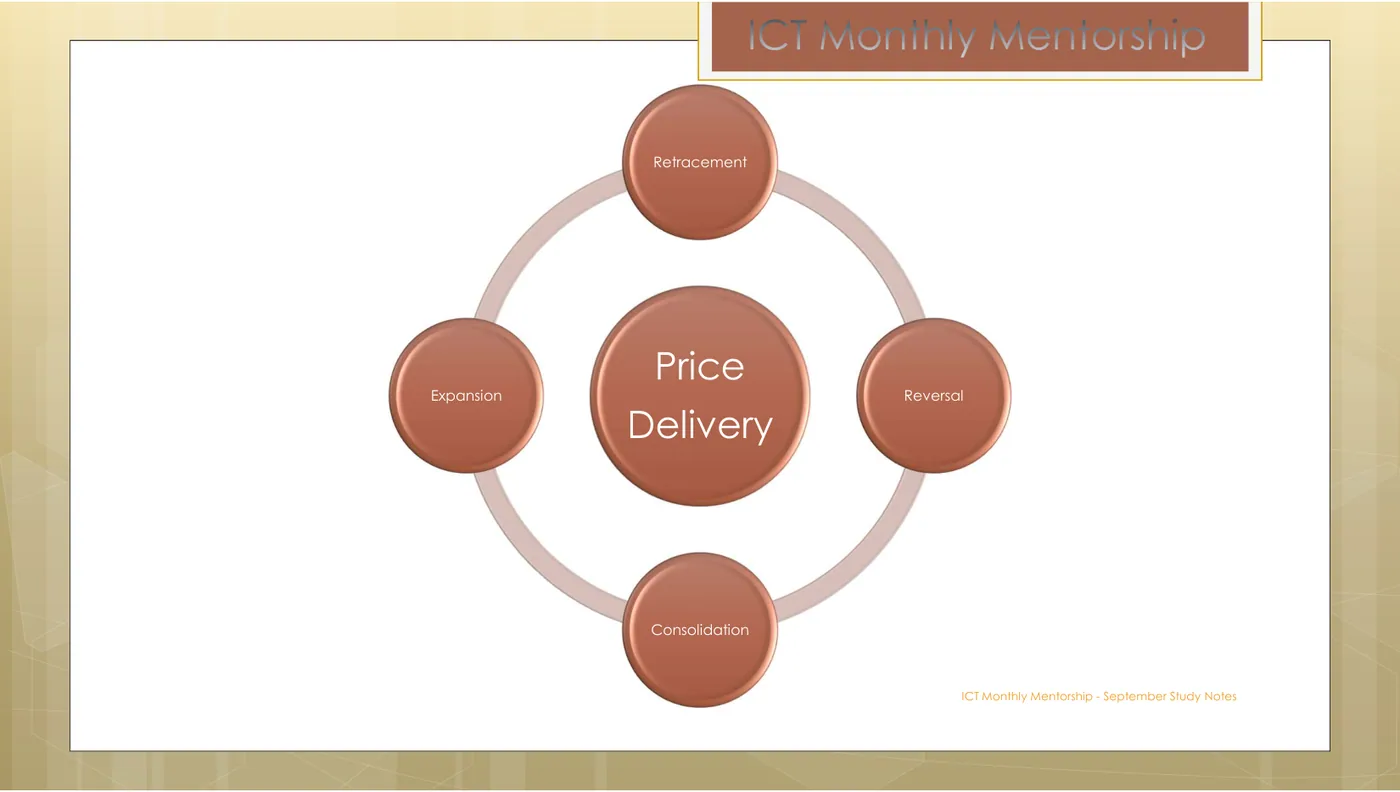
The mapping: one phase, one thing to look for
| Phase | What it is, in ICT’s words | The one reference point |
|---|---|---|
| Expansion | “Price moves quickly from a level of Equilibrium” | Orderblock at or near that equilibrium |
| Retracement | “Price moves back inside the recently created Price Range” | Fair value gaps and liquidity voids |
| Reversal | “Price moves the opposite direction… the Market Makers have ran a level of Stops” | Liquidity pools above old highs / below old lows |
| Consolidation | “Price moves inside a clear trading range… allowing orders to build on both sides” | Equilibrium — the 50% of the range |
That table is the grammar of the whole method. Read it as a rule about attention:
Identify the phase first. The phase tells you which single object to look for. Everything else on the chart is, for the moment, irrelevant.
You are not looking for thirty things. You are looking for one thing, and which one is determined by something you can read off the chart in five seconds.
Phase 1 · Expansion
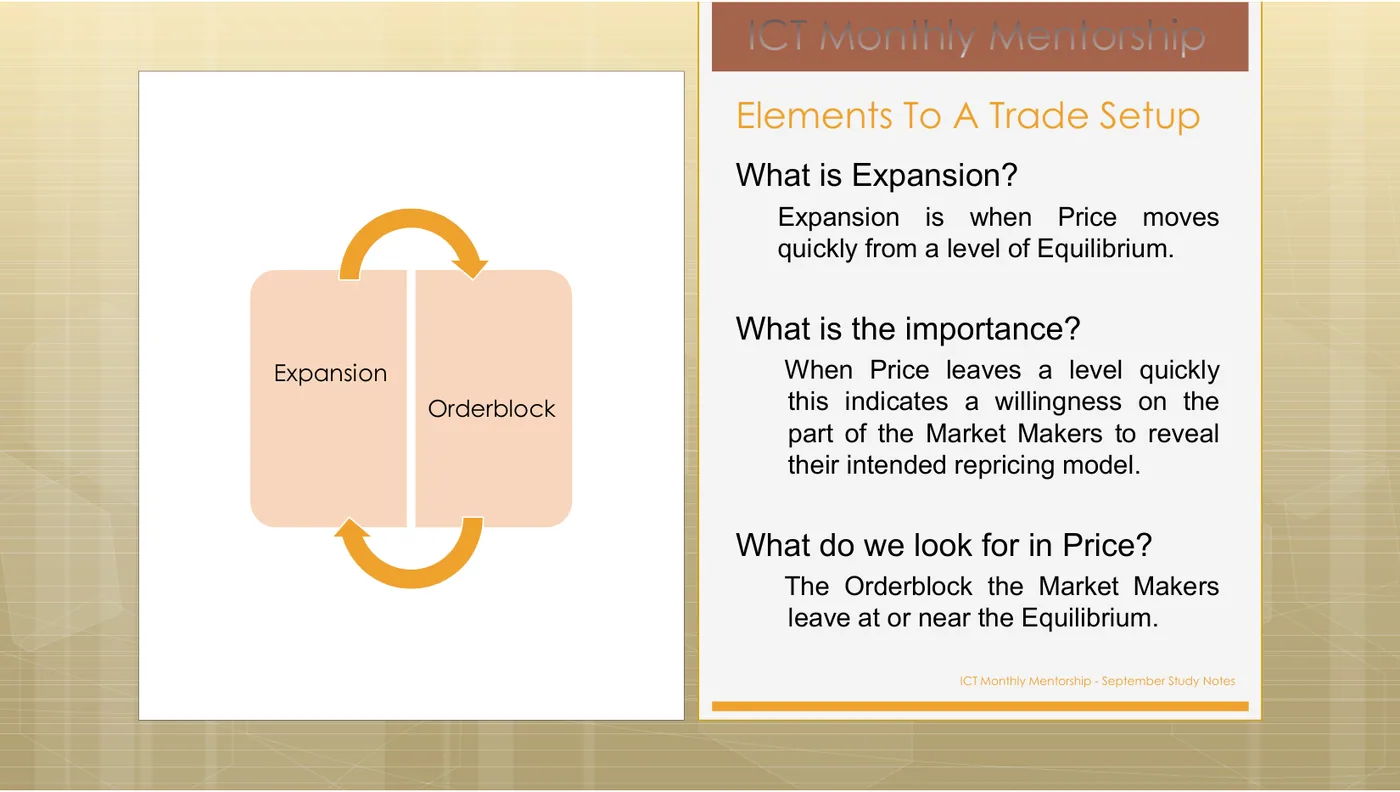
Expansion is when Price moves quickly from a level of Equilibrium. What is the importance? When Price leaves a level quickly this indicates a willingness on the part of the Market Makers to reveal their intended repricing model. What do we look for in Price? The Orderblock the Market Makers leave at or near the Equilibrium.
Two things in that paragraph do real work.
“Reveal their intended repricing model.” Speed is information. A fast move away from a level is the clearest statement of intent you will get, and it is free — you do not have to predict it, you only have to notice it happened.
“The Orderblock the Market Makers leave at or near the Equilibrium.” Note leave. The order block is not the cause of the move; it is the residue. This is backwards from how most people trade order blocks, and it is why you look for it after expansion rather than before.
You are looking at ICT's own definition of Expansion. Before you reveal his chart: on your own EURUSD daily, find the most recent move that fits this description — quick, away from a middle. Then say out loud where the order block should be. Reveal shows the chart ICT used to teach this phase on the very next slide.
Phase 2 · Retracement
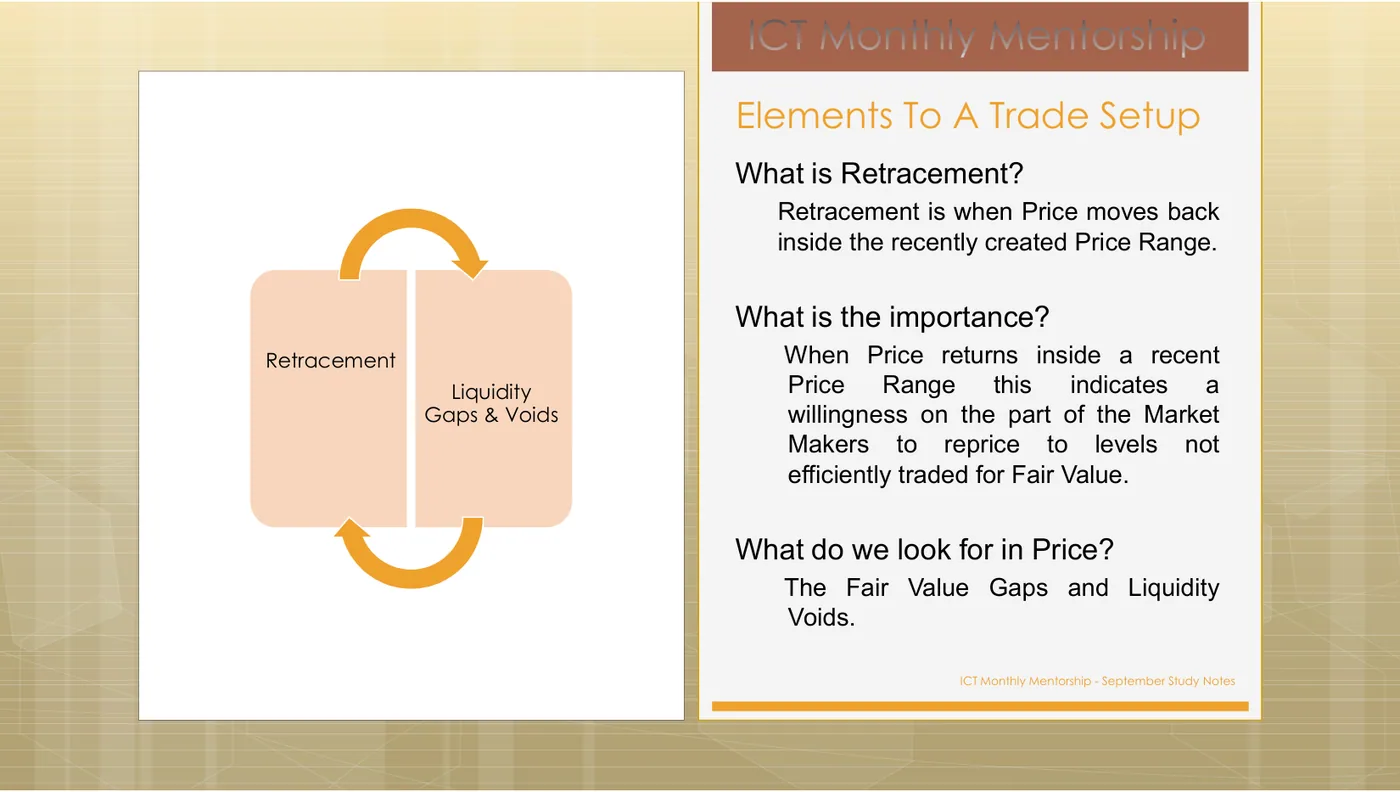
Retracement is when Price moves back inside the recently created Price Range. What is the importance? When Price returns inside a recent Price Range this indicates a willingness on the part of the Market Makers to reprice to levels not efficiently traded for Fair Value. What do we look for in Price? The Fair Value Gaps and Liquidity Voids.
“Levels not efficiently traded for Fair Value” is the causal claim. A fast move leaves parts of the range barely traded. A retracement is not weakness or a change of mind — it is the market going back to do business at prices it skipped.
Which means the retracement has a destination you can name in advance: the inefficiency. That is a very different thing from waiting to see how deep a pullback goes.
The definition of Retracement is on screen. Before revealing: on a chart of your own, find a completed retracement and name — in advance — the specific price area it was going back for. Reveal shows ICT's chart for this phase, on the next slide.
Phase 3 · Reversal
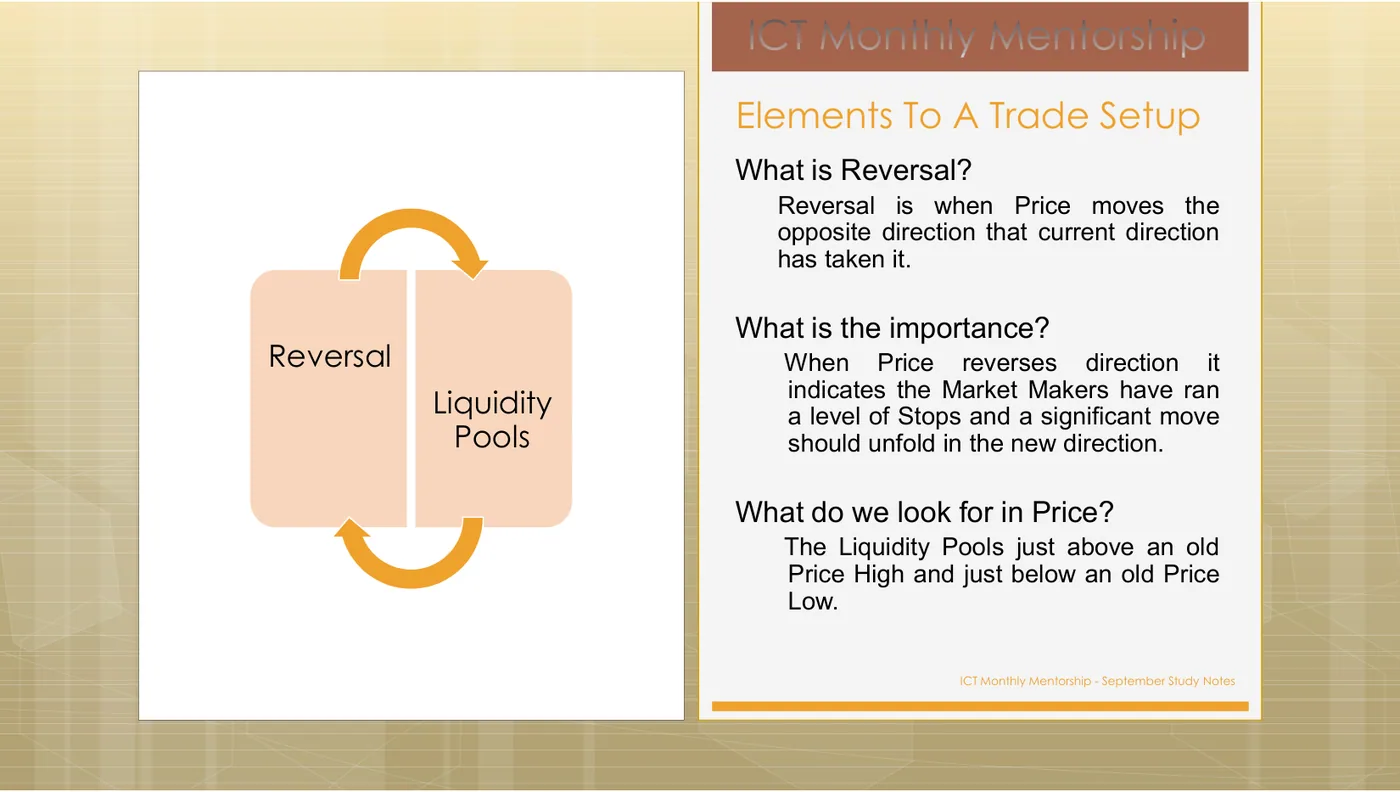
Reversal is when Price moves the opposite direction that current direction has taken it. What is the importance? When Price reverses direction it indicates the Market Makers have ran a level of Stops and a significant move should unfold in the new direction. What do we look for in Price? The Liquidity Pools just above an old Price High and just below an old Price Low.
The word to underline is “ran.” A reversal in this method is not a pattern that appears at a turn; it is a consequence of stops being taken. The pool is the cause, the reversal is the effect, and the pool is visible before the reversal happens.
This is the single most transferable idea in Tier 1, and M2 does nothing else.
The Reversal definition is on screen. Before revealing: find the last significant turn on a chart you know well, and answer one question — what got run immediately before it turned? Reveal shows ICT's own chart with the reversals marked.
Phase 4 · Consolidation
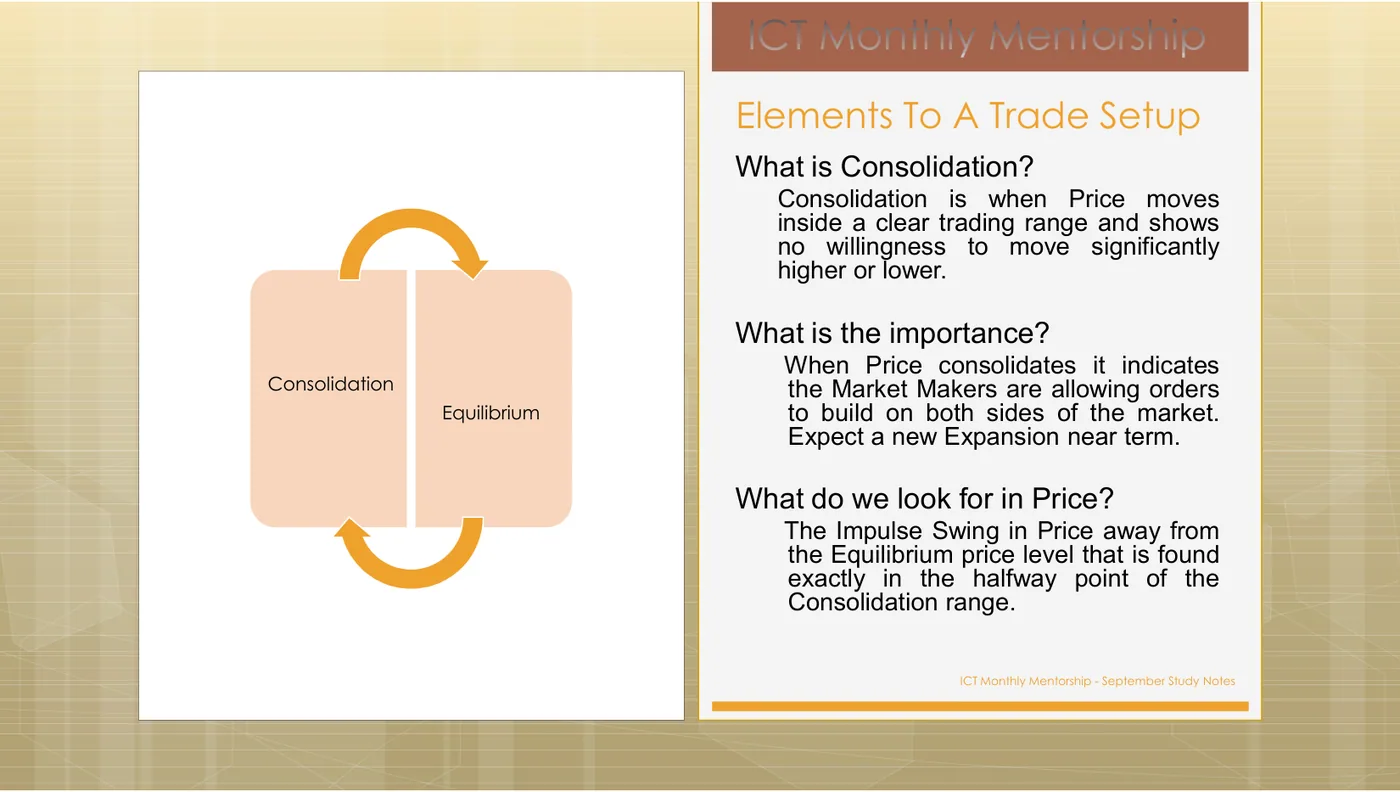
Consolidation is when Price moves inside a clear trading range and shows no willingness to move significantly higher or lower. What is the importance? When Price consolidates it indicates the Market Makers are allowing orders to build on both sides of the market. Expect a new Expansion near term. What do we look for in Price? The Impulse Swing in Price away from the Equilibrium price level that is found exactly in the halfway point of the Consolidation range.
Consolidation is the phase most traders treat as dead time. Read what it says instead: orders are building on both sides. Stops are accumulating above and below. The range is not the absence of a setup — it is the construction of the fuel for the next one, and its 50% line is the reference you carry forward.
“Expect a new Expansion near term” closes the loop. Consolidation → expansion → retracement → reversal → consolidation, forever.
The Consolidation definition is on screen — read the last sentence carefully. Before revealing: find a range on your chart, mark its 50%, and answer whether you have historically treated ranges as dead time or as construction. Reveal shows ICT's chart of this phase.
The cycle has a clock: the True Day
Two variables, not one. The phases tell you what; the IPDA window tells you when it counts.
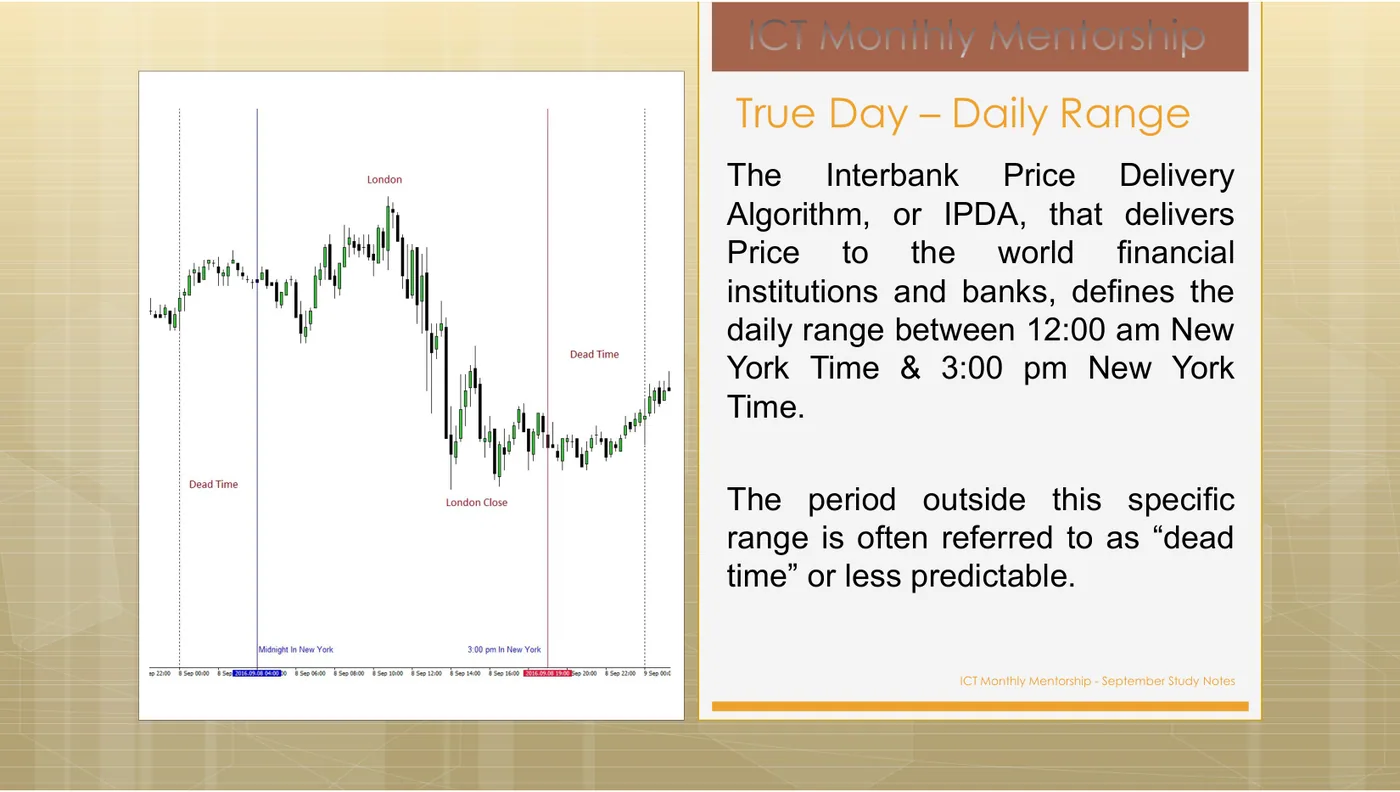
The Interbank Price Delivery Algorithm, or IPDA, that delivers Price to the world financial institutions and banks, defines the daily range between 12:00 am New York Time & 3:00 pm New York Time. The period outside this specific range is often referred to as “dead time” or less predictable.
Midnight to 3 p.m. New York. That is the window in which the day’s range is built; outside it, his own word is less predictable. You do not have to accept that as physics to use it as a filter — it costs nothing to stop drawing conclusions from the hours the material tells you are noise.
The session overlay
Month 1 does one more thing on page 4, and it is the bridge from this abstract cycle to an actual trading day. It maps each phase to a session.
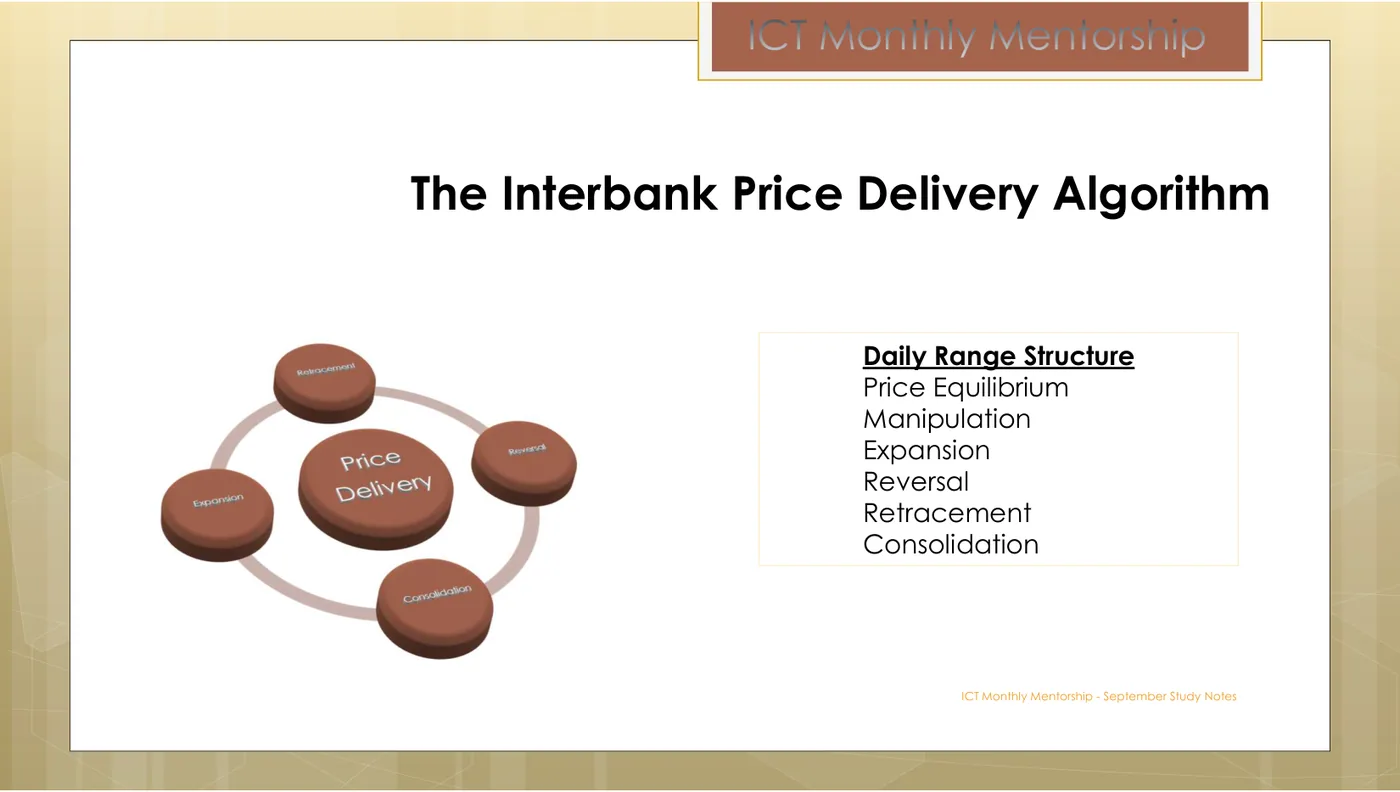
A. Context or Framework surrounding the idea. 1) Expansion = Judas Swing 2) Retracement = New York Session 3) Reversal = London Swing 4) Consolidation = Asian Range
Month 1 p.4 maps the phases to sessions: Expansion = Judas Swing, Retracement = New York, Reversal = London Swing, Consolidation = Asian Range. How should you use that slide?
What you are actually looking at
Before Month 1 introduces a single array, it gives a seven-line summary of everything on a chart worth attention. It is the most compressed page in your library.
Old Highs – Buy Stops or Buy Side Open Float. Old Lows – Sell Stops or Sell Side Open Float. Clean Highs – Liquidity Pool of Buy Stops. Clean Lows – Liquidity Pool of Sell Stops. Sharp Runs In Price – Liquidity Voids. Swing High – Three candle pattern. The up candle. Swing Low – Three candle pattern. The down candle.
Seven lines. Five are about liquidity (M2). Two define a swing point as a three-candle pattern — a countable thing, not a judgement call (M3). There is nothing else on the list. No indicator, no trendline, no pattern name.
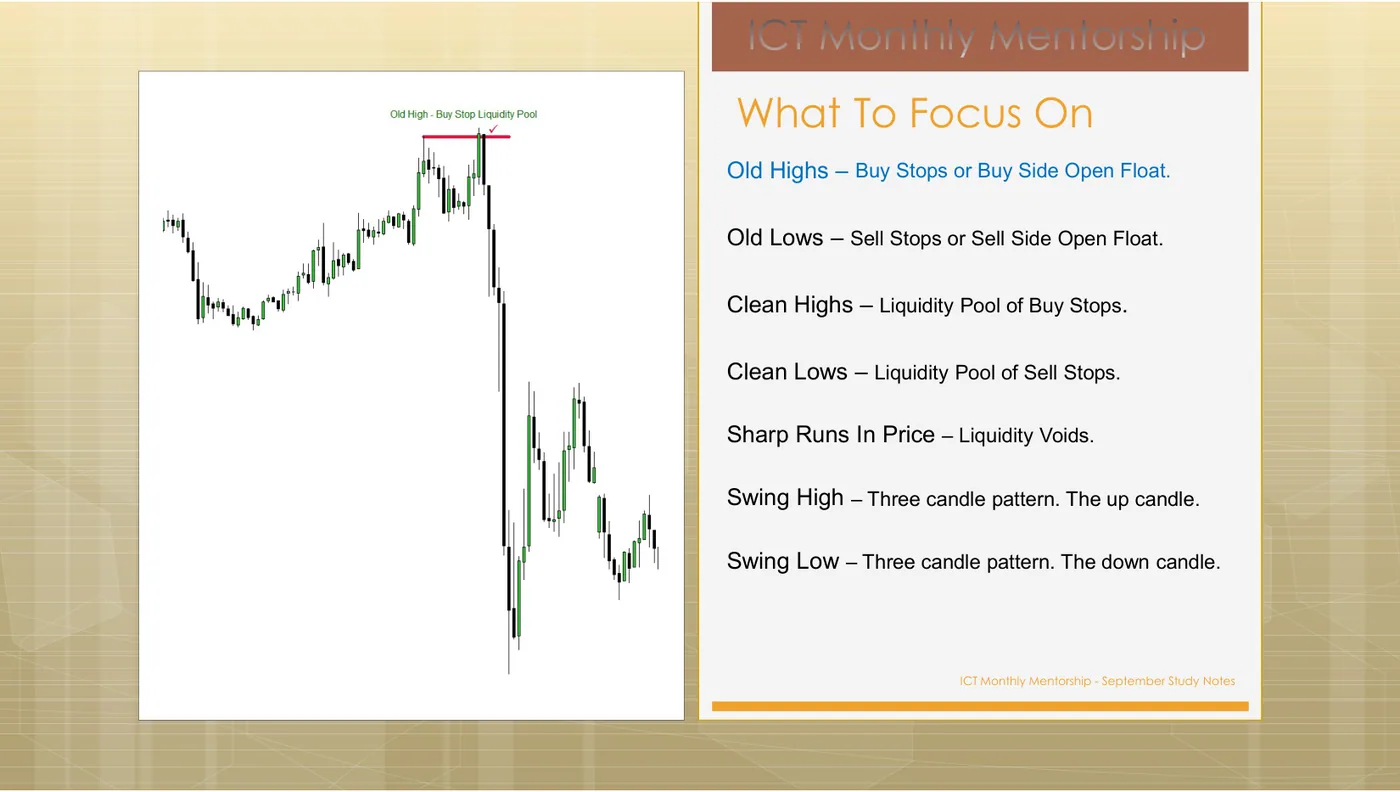
Month 1's 'What To Focus On' slide lists seven things. What is notable about what it leaves out?
This is the True Day definition — the 00:00 to 15:00 New York window in which the daily range is defined. Before revealing: sketch how the four phases would be laid out inside a single day. Reveal shows ICT's own version on the next slide.
The frame, used in anger
Here is what the four phases do to your actual process. Before this module, a chart raises the question what setup is here? — which has no reliable answer, because seven things are always visible.
After it, the chart raises a different question, and the question is answerable:
- Which phase is price in right now? Fast move from a middle? Coming back into a range it just made? Just taken out an old high or low? Grinding sideways? One of those four is true, and usually obviously so.
- Therefore, what am I looking for? The phase names it. One object.
- Is that object actually present? Often it is not — and that is a complete answer. You are done, and you have not risked anything.
Step 3 is the one nobody trains, and it is why roughly a quarter of the graded drills in this course have “nothing here” as the correct response.
Price has just left a range with three large one-directional candles. Which phase are you in, and what is the one thing you look for?
Price has just traded through an obvious equal-highs level and immediately closed back below it. Phase, and reference point?
You open a 4-hour chart. Price is drifting in a loose 90-pip band with no clean edges, no recent sharp move, and no old high or low nearby. What is the correct output?
Common failure modes for this module
Labelling every wiggle. The phases are read at the scale you are trading. On a daily chart, a two-hour pullback is not a retracement phase; it is noise inside one daily candle. Pick the timeframe you are framing on and stay on it — M3 makes this rigorous and M10 makes it a procedure.
Forcing a phase. Some charts are genuinely ambiguous — mid-transition, or consolidating so loosely you cannot call it a range. “I cannot label this cleanly” is a legitimate output, and it maps directly onto “I am not trading this.”
Treating the phases as a prediction. The cycle does not tell you what happens next. It tells you what to look for now. Expansion does not promise a retracement will reach the gap; it tells you the gap is the thing to watch.
Which of these correctly describe the relationship between the phases? (Select all that apply.)
The True Day slide says the daily range is defined between 00:00 and 15:00 New York time, and calls the rest 'dead time' or less predictable. What is the disciplined way to use this?
The decision rule
- When
- You open a chart on the timeframe you are framing on.
- Then
- Name the current phase out loud — expansion, retracement, reversal or consolidation — and then look for only that phase's one reference point: order block, fair value gap or void, liquidity pool, or the 50% of the range. Everything else on the chart is out of scope until the phase changes.
- Otherwise
- If you cannot name the phase in about ten seconds, the chart is mid-transition. Close it and check the next pair. An unlabelled chart is not a setup you have not found yet — it is a chart with no setup on it.
Done with M1?
Mark it complete only if you could teach the decision rule to someone else without scrolling back up. Completion is stored in this browser.