Market Structure & Swing Points
The 3-candle swing definition and the short-term / intermediate-term / long-term nesting hierarchy that makes structure countable.
“'The trend' isn't an opinion — it's a countable structure, and it's different on each timeframe simultaneously without contradiction.”
“The trend” is not an opinion
Two traders look at the same daily chart. One says uptrend, one says the trend just broke. Both point at real features. Neither can settle it, so both revert to feel — and feel is not a thing you can put in a written plan.
Your library settles it, and the settlement is almost aggressively simple: a swing point is a three-candle pattern, and everything above it is built by counting.
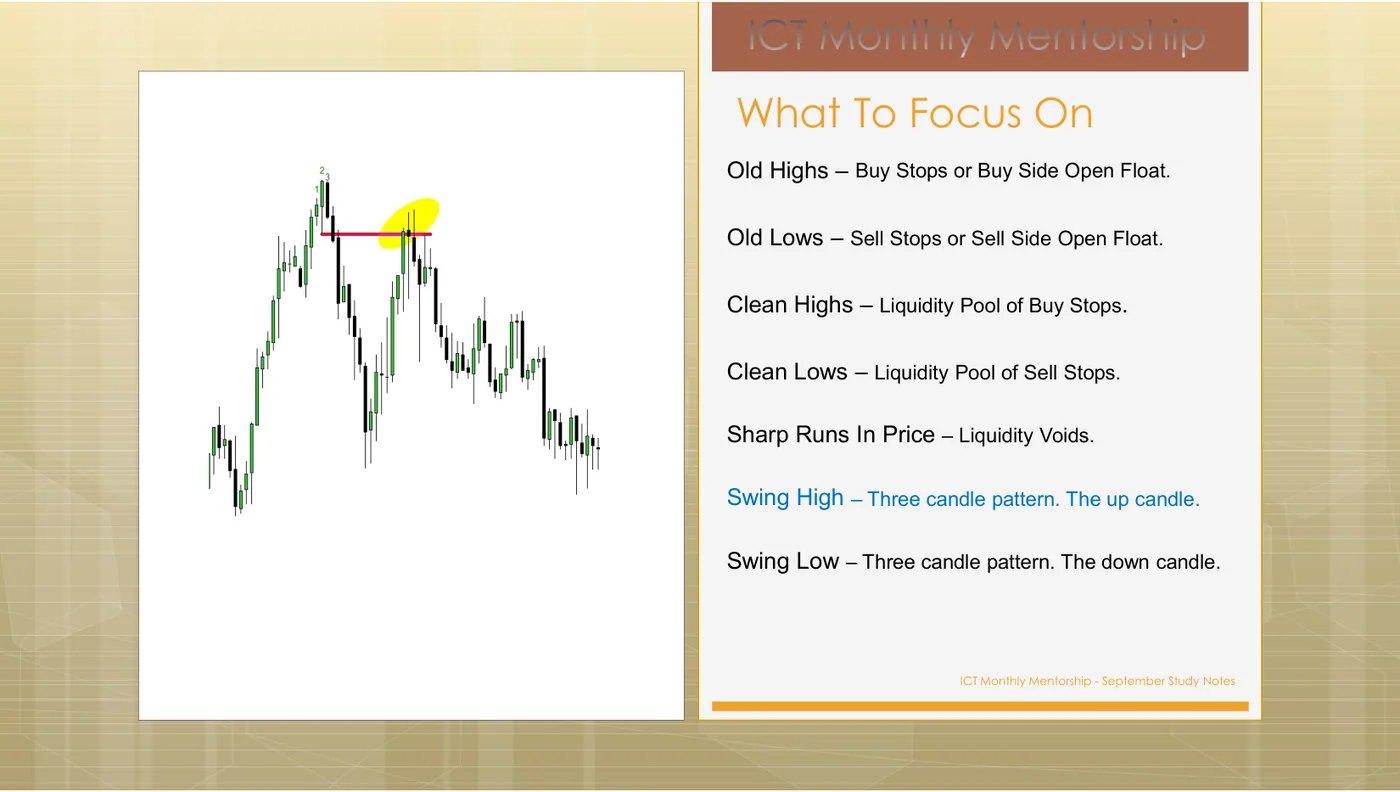
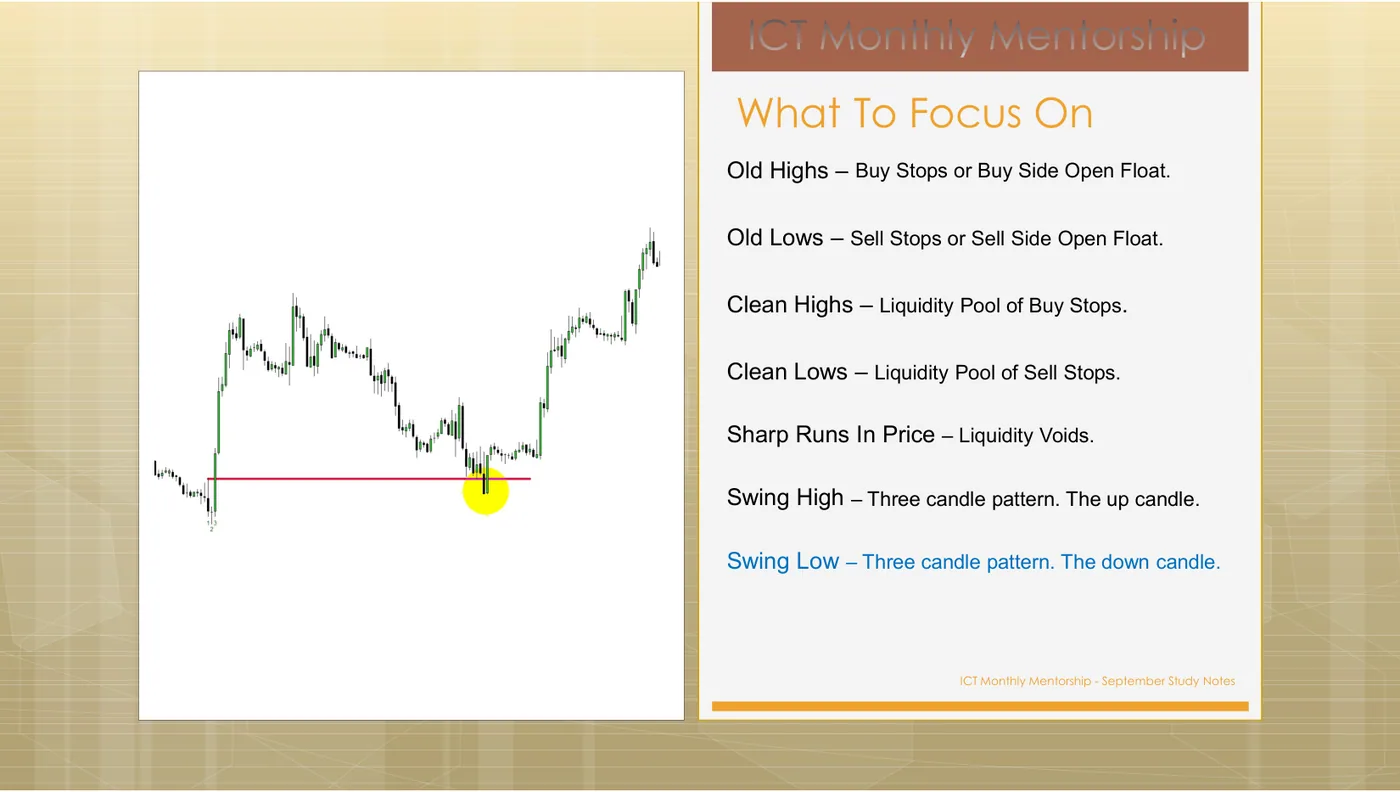
Swing High – Three candle pattern. The up candle. Swing Low – Three candle pattern. The down candle.
Three candles. A swing high is a candle with a lower high on each side; a swing low is a candle with a higher low on each side. There is no discretion in it — you can count them, and two people counting will agree.
The hierarchy: three tiers, built by counting
Here is the passage that makes structure countable. It is from the ICT Core Concepts note — a plain-text file in your library, so this is exact.
Generally, the market trades from short term lows to short term highs and back to a new short term low. As these short term highs and lows form, they will nest or develop a “market structure” of price action. Any short term low that has higher short term lows on both sides of it is considered an intermediate term low. Any short term high that has lower short term highs on both sides of it is considered an intermediate term high. Any intermediate term low that has higher intermediate term lows on both sides of it is considered a long term low. Any intermediate term high that has lower intermediate term highs on both sides of it is considered a long term high. This is universal on all time frames and allows you to visualize the trend.
Notice the recursion. Each tier is defined only in terms of the tier below it, using the identical test:
| Tier | Test | Marked on chart as |
|---|---|---|
| Short term low (STL) | A candle with a higher low on each side | the raw three-candle swing |
| Intermediate term low (ITL) | An STL with a higher STL on both sides | a bigger dot |
| Long term low (LTL) | An ITL with a higher ITL on both sides | the biggest dot |
The mirrored test builds STH → ITH → LTH. Same rule, upside down.
Two consequences fall straight out of it, and both are practically important.
First: the tiers appear late. An intermediate term low cannot be confirmed until a later short term low forms above it. You are always labelling with a lag, and pretending otherwise is how people convince themselves they identified a long-term low in real time. Structure is a description of what has happened, not a live signal.
Second: this is what “the trend” means here. An uptrend is not a slope or a moving average — it is a sequence of higher intermediate-term lows. When that sequence stops, the trend on that tier has stopped, and you can say exactly which candle settled it.
A candle's low is higher than the low of the candle before it and higher than the low of the candle after it. What have you got?
You have marked six short-term lows on a daily chart. The third one is lower than the two on either side of it. What tier is it?
Which tier you use is your trading style
The same note tells you which tier belongs to which horizon — and this is the passage that sets this course’s default.
When focusing on a long trade, you could use market structure to highlight the short, intermediate, & long term lows and position yourself near a long term low for a position trade lasting weeks or months. You could also try to position yourself near an intermediate term low for a swing trade lasting days. Lastly you could position yourself near a short term low to day trade in the direction of market structure and market flow.
Swing trading is the intermediate-term tier. That is the sentence that makes your default concrete: you are looking to position near intermediate-term lows for trades lasting days. Not at every three-candle swing low — at the ones that have higher short-term lows on both sides.
That one filter removes most of the chart, and it removes it in the direction that suits how you actually trade.
You are swing trading. Which tier of the hierarchy are you positioning against, and why does it matter?
Three timeframes, and which one leads
Frame your trades on at least 3 time frames. Know the time frame that you are trading. Position Trades: Monthly, weekly, & daily time frames. Swing Trades: Daily, 4 hour, & 1 hour time frames. Short Term Trades: 4 hour, 1 hour, & 15 minute time frames. Day Trades & Scalps: 1 hour, 15 minute, & 5 minute time frames. Your main focus should be on the highest of the 3 time frames that you are trading.
Read the last sentence as a rule about authority, because that is what it is.
- The highest of your three timeframes decides direction. For swing trading: the daily.
- The middle timeframe locates the level. The 4-hour: this is where you find the array you will actually trade from.
- The lowest timeframe times the entry and nothing else. The 1-hour. It has no vote on direction.
The shortest time frame will be used to enter and signal potential reversal clues. The highest probability trades are made in the higher time frame direction. For example, on swing trades, you should trade in the direction of market structure on the daily chart.
Daily structure is up. You drop to the 1-hour and it is making lower highs. What have you learned?
For a swing trade, which three timeframes does your library specify, and what is each one for?
Simultaneous truth across timeframes
The reason structure feels contradictory is that people expect one answer. There is one answer per tier, per timeframe, and they are all true at once.
On a single EURUSD chart at one moment, all of these can be correct:
- Long-term structure on the weekly: higher long-term lows — up.
- Intermediate structure on the daily: last two ITLs are lower — down.
- Short-term structure on the 1-hour: making higher STLs — up.
Nothing is broken. You are looking at a daily downtrend, currently in a retracement higher, inside a weekly uptrend. The three statements describe three different scales of the same price.
The discipline is to say which one you are trading and then act only on that one. Write it down. “I am trading daily intermediate structure.” Everything above it is context; everything below it is timing.
Weekly long-term structure is up; daily intermediate structure has just made a lower intermediate-term low; 1-hour short-term structure is up. Which statements are true? (Select all that apply.)
On your daily chart, the last two intermediate-term lows are at almost exactly the same price. What does the count give you?
What about “market structure shift”?
This deserves a straight answer, because it is one of the era-mismatch cases from M0.
Market structure shift is in your library, and it is rare. It appears in a handful of files. It is not defined with the rigour of the STH/ITH/LTH hierarchy, and there is no slide anywhere in the mentorship that gives it validation criteria the way Month 4 does for an order block.
That is not a reason to avoid the idea — a break of the last swing that held is obviously meaningful, and Month 4 p.31 uses precisely that language when setting up the mitigation block. It is a reason to prefer the hierarchy when you need a definition you can defend. If someone asks you why you think the trend changed, “the last intermediate-term low was violated and the subsequent one is lower” is a checkable statement. “There was a market structure shift” is a label.
Someone asks why you think the daily trend has changed. Which answer is defensible from your own library?
Defining the range — a preview of M4
Everything M4 does depends on the range you measure being anchored to something real. Now you have the anchor.
A dealing range runs from a confirmed swing low to a confirmed swing high on the timeframe you are framing on, at the tier you are trading. For swing trading that means: daily chart, intermediate-term low to intermediate-term high.
Choose the wrong anchors and the 50% line is fiction — and every premium/discount judgement, every entry, and every stop you build on it inherits the error silently. That is why structure comes before equilibrium in this course and not after.
You are about to measure a dealing range on a daily chart for a swing trade. What are the correct anchors?
The decision rule
- When
- You need to state the trend, or you need to anchor a range.
- Then
- Count, do not judge. Mark the three-candle swings on your framing timeframe, promote each swing that has two higher (or two lower) neighbours of its own tier, and read the trend off the sequence of intermediate-term points. For swing trading, that is the daily chart and the intermediate tier.
- Otherwise
- If the tiers cannot be counted — too few confirmed swings, or the last two are equal — you do not have structure yet, and you have nothing to anchor a range to. Do not substitute a moving average or a trendline for the count.
Done with M3?
Mark it complete only if you could teach the decision rule to someone else without scrolling back up. Completion is stored in this browser.