SMT Divergence & Correlation
Correlated-pair and USDX SMT as confirmation of a sweep — never as a standalone entry.
“When the pair that should have made a new low doesn't, someone is absorbing.”
One question, asked at a level you already marked
SMT is the shortest module in Tier 3 and the easiest to misuse. It is one question, and it only has meaning at a level you decided on beforehand:
The two things that normally move together arrived at the same level. Did they both make the new extreme, or did one of them fail to?
That is all of it. The failure is the signal, the level is the precondition, and the direction of the trade was already decided by M10.
The definition, in his words
If you are anticipating a support level to be traded to and the Fiber fails to make a lower low into that higher time frame support level while the Cable succeeds to make a lower low into that same level, then that is bullish SMT divergence. Look for both of them to trade higher because they are closely correlated.
Here is that sentence played out, clause by clause:
Take the sentence apart, because every clause is load-bearing:
- “If you are anticipating a support level to be traded to” — you had the level before. This is the precondition, and skipping it is how SMT becomes a way to justify anything.
- “fails to make a lower low” — the divergence is a non-event: the thing that should have happened didn’t.
- “into that same level” — at the level, not somewhere nearby, not on a different swing.
- “Look for both of them to trade higher” — the read is on the pair, then on the correlation.
The mechanism ICT gives for the failure is absorption:
In this situation there is so much selling going into the Cable that the smart money cannot hide their actions (the flows are so large).
Smart money moves large flows and by that very fact, their movements have huge footprints. It cannot be hidden from the informed trader.
That is a story, and your library gives no way to verify it. What you can verify is the observable: one of two correlated instruments failed to confirm at a level you named in advance. The story is optional; the observation is the tool.
In ICT's definition of bullish correlated-pair SMT, which clause is the precondition that most people skip?
Two flavours, and the direction trap
NOTE: Note how the USDX SMT divergence compares USDX lows to Cable & Fiber highs. Correlated pair SMT divergence compares Cable highs to Fiber highs.
| Compare | Because | |
|---|---|---|
| Correlated pair | Cable low ↔ Fiber low (same side) | EURUSD and GBPUSD move together |
| USDX | USDX low ↔ Cable high (opposite sides) | The dollar index moves inversely to the pair |
A rising US Dollar means bearish foreign currency prices. A falling US Dollar means bullish foreign currency prices.
We see a lower high in the Cable and a lower low in the USDX. When the USDX makes a lower low, we would expect to see a higher high in the Cable.
Getting this inversion wrong produces a confident read in exactly the wrong direction, which is worse than no read at all. Say it out loud before you use it: pair against pair, same side; index against pair, opposite side.
You are watching GBPUSD arrive at a daily support level. On the dollar index, what would you have to see for this to be bullish SMT?
EURUSD and GBPUSD both arrive at a level you marked yesterday. EURUSD makes a new low; GBPUSD makes a new low too, slightly deeper. What have you got?
Where it belongs in the process: confirmation, never initiation
Month 12 puts SMT in the chain explicitly, and the last line of the slide is the one to keep:

Confirmation Seen In Other Markets?
If I have a Bullish Market Structure determined in my market of interest: I look for Intermarket Analysis to support this idea in positively correlated markets and opposed to it in negatively correlated markets.
I scan for SMT Divergence to confirm a opinion on Price.
Confirm an opinion on price. The opinion comes first — from M10’s cascade. SMT is the second pair of eyes, and its only job is to tell you whether to act on a level you already found.
Your library reinforces this from two more directions:
You are not only looking for SMT divergence to take a trade, you are only using it around predetermined levels with a trade idea in mind.. then once the pattern unfolds, that is the green light to get into the trade.
When trading you want the USDX and currency pairs to confirm each other, otherwise it is a sucker play.
You have no bias from the cascade today, but you notice a clean SMT divergence between the two pairs on the 1-hour. What does this module say?
Timeframe, and when to expect it
The more significant price swings will happen on the 15 minute time frame and up.
This divergence will form at a predetermined support level.
Expect these to unfold during kill zones.
And the connection back to M9, stated in four words elsewhere in the same document: “SMT divergence confirms Judas Swings.”
That is the two modules locking together. M9 gave you a move that runs a pool against your bias and reverses. M11 gives you a second instrument that should have run the same pool and didn’t. When both are true at a level M10 handed you, you have the strongest confluence this course teaches — and it is still not a reason to skip the 3:1 filter.
For your swing default, ICT is explicit about the slower version too:
SMT divergence is generally used on the 15 minute time frame and higher.
Use a line chart when looking for SMT divergence.
The one that fails to make a lower low is failing to do so for a reason. They are accumulating such a large position that price is unable to make it any lower. Upon seeing the SMT divergence above, you would start looking for buys.
The line-chart instruction is practical, not stylistic: candle wicks make two charts look like they disagree constantly. On closing prices the question “did it make the lower low?” has one answer.
"SMT divergence confirms Judas Swings." How do M9 and M11 fit together?
Why does ICT tell you to use a line chart when looking for SMT divergence?
The index example, and why it is here
The only SMT charts in your mentorship slides are drawn on stock index futures:
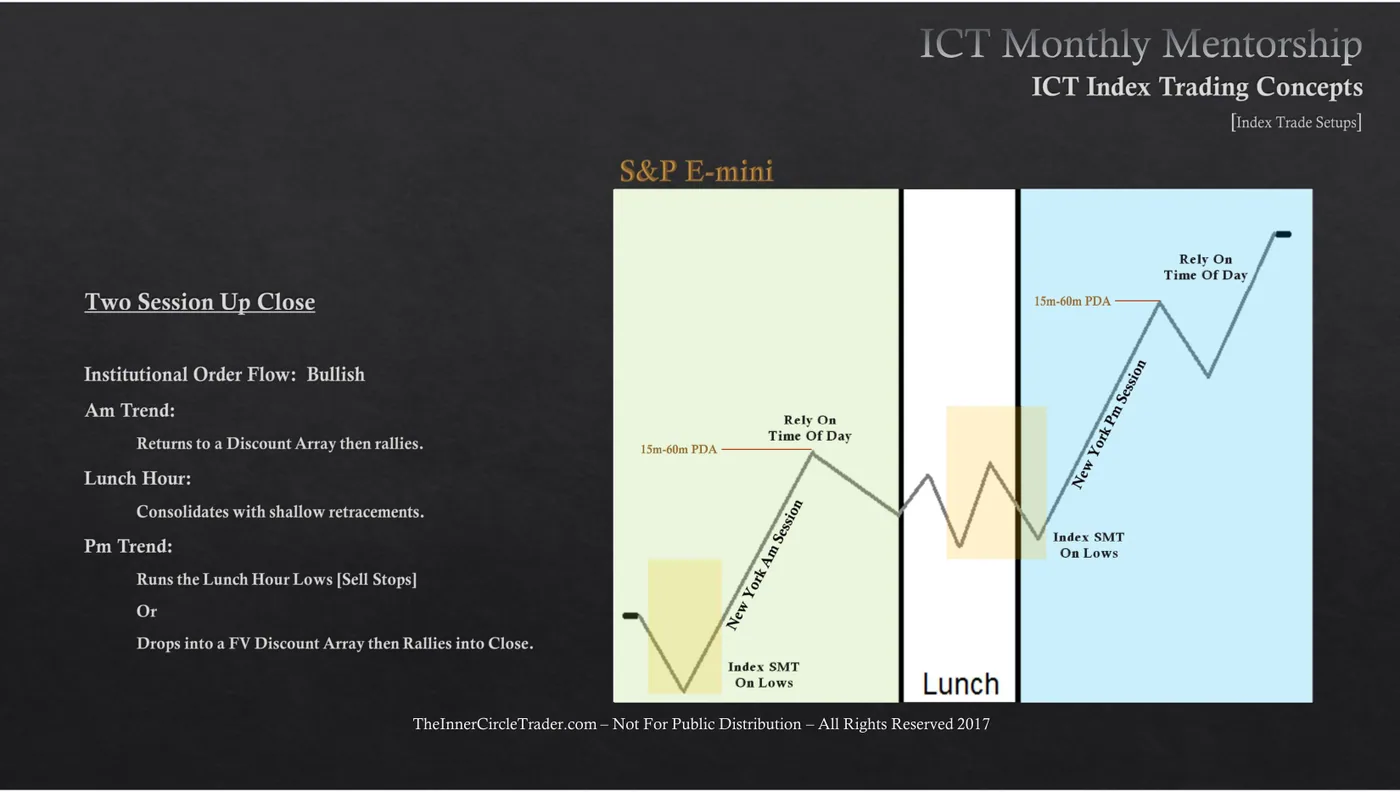
Your forex SMT material is prose rather than charts — SMT Concepts.txt and the
swing webinar, both quoted above and both fully text-extracted, which is why the
quotes in this module are unusually long. That is the honest shape of your
library on this topic.
The parts you can read but should not automate
Short Term Perspective:
- Correlation Analysis a) USDX SMT Analysis b) Correlated Pair SMT Analysis
- Time & Price Theory
Month 4 and Month 11 go much further — interest-rate triads, bond-yield divergence, COT. Read them if you want the full picture. They are context you can read and not a routine you can run, for the same reason given in M10: they need data you would have to fetch by hand every week, and a step you abandon is worse than a step you never had. Nothing in this course requires them, and nothing in this course claims to know what they are worth.
This module quotes prose heavily and shows one figure drawn on a stock index. Which of these are honest reasons? (Select all.)
The decision rule
- When
- M10's cascade has handed you a specific level and price is arriving at it.
- Then
- Open the correlated instrument — the other pair, or the dollar index — on a line chart at 15 minutes or higher, and ask one question: did it confirm the new extreme at this level, or did it fail to? If it failed, treat that as confirmation of the trade you had already framed, and proceed to sizing and the 3:1 filter.
- Otherwise
- If both confirmed, you have no SMT here — which is a result, not a reason to look harder. If you had no predetermined level, do not look at all: a divergence found by scrolling confirms whatever you already wanted. And under no circumstances is SMT alone an entry.
Homework
Two charts, one question: did the pair that should have made the low, make it?
Set the replay up
- Split the layout into two panes, EURUSD above GBPUSD, synced timeframes.
- Use a line chart for the comparison — ICT does, and candle wicks make divergence harder to see.
- Mark one higher-timeframe support or resistance level you expect price to reach, before you step anything.
Then, bar by bar
- Bar Replay to a point where both pairs are approaching your marked level.
- Step forward until the level is reached.
- Ask exactly one question: did both pairs make the new extreme, or did one fail?
- If one failed, mark it and note which. If both made it, log "no SMT" — that is a result, not a failure.
- Repeat at ten different levels.
Self-assessment — tick only what is honestly true
Done with M11?
Mark it complete only if you could teach the decision rule to someone else without scrolling back up. Completion is stored in this browser.