Top-Down Framing
The Monthly→Weekly→Daily→4H→1H cascade and the gating logic that makes a timeframe neutral when its order-flow condition is not met.
“HTF doesn't mean 'glance at the daily'. It means the daily hands the 4H a specific level, and if it can't, I don't trade today.”
“Check the higher timeframe” is not a procedure
Everyone says look at the higher timeframe. Almost nobody says what to do with it, so in practice it becomes a glance at the daily, a vague feeling of bullish I think, and then twenty minutes on the 5-minute chart doing whatever you were going to do anyway.
Your library has the actual procedure, written out step by step, in Month 12. It is one slide, it is dense, and it is the most operationally useful page in the whole mentorship.

Read one block of it exactly as written:
Note The Present Daily Chart Trading Range – Where Have We Recently Traded From?
Determine Institutional Order Flow On Daily Chart – Ideally Down Close Candles Support Price & Large Candles Form With Up Closes
Note The Daily Chart PD Arrays – Relative To The Current Trading Range [The Obvious Range Price Is Trading Right Now]
If Down Close Candles Are Supporting Price & Or Price Has Recently Reacted Bullishly On A Discount Array – Daily Order Flow Is Bullish – Carry Daily PD Arrays To 4Hour Chart
If The Above Condition Is Not True – Daily Is Neutral
That block appears four times on the slide, once for monthly, weekly, daily and 4-hour, with only the timeframe name changed. Which tells you the shape of the whole thing:
Top-down is one test, applied repeatedly, whose output is a level being handed downward — or the word NEUTRAL.
Here is the whole module as a moving picture: the test, a day where every chart passes, a day where the daily fails, and the reward gate at the end. The charts are schematic — the logic is the point.
Transcript
- Top-down is one test, asked five times. Each timeframe hands a price down — or says NEUTRAL.
- The test: where is the range, is order flow bullish, where are the arrays relative to that range. Three questions, in this order. They fail independently — and NEUTRAL is a real answer.
- A day that passes: each chart that passes hands the next one a price, not a feeling.
- Each step refines, never overrules — and the zone, and your stop, get smaller. Same idea, smaller stop.
- A day that fails: monthly and weekly pass, but the daily fails its order-flow test.
- NEUTRAL hands down nothing. No level for the 4-hour means no trade today.
- The last gate: measure entry array to target array before you place anything. A target at 2.4R is under 3:1 — sidelines. A target at 3.6R passes. (Example numbers, to show the measurement.)
- The arithmetic decides — not how good the chart looks.
- The rule: if the daily cannot hand the 4-hour a level, you do not trade today.
Month 12's top-down slide repeats the same block of instructions four times, once per timeframe. What does that repetition tell you about the procedure?
The three parts of the test
Every block asks the same three things in the same order. Learn them as three, because they fail independently. (ICT abbreviates the second one IOF — institutional order flow: which way the big money is pushing on that chart.)
1. Where is the range?
“Note The Present [X] Chart Trading Range – Where Have We Recently Traded From?”
This is M4, and it is first for a reason. Before order flow, before arrays, you must state the dealing range you are measuring on this chart. Every timeframe has its own range and its own equilibrium, and they routinely disagree — the 4H can be in discount of its own range while sitting in premium of the daily’s. That is not a contradiction; it is the entire reason the cascade exists.
The bracketed aside is the operative instruction: “[The Obvious Range Price Is Trading Right Now]”. Not the biggest range, not the one that makes your idea work. The obvious one.
2. Is order flow bullish, and how would you know?
This is the part most people wave at, and ICT gives it a checkable definition:
Determine Institutional Order Flow On Daily Chart – Ideally Down Close Candles Support Price & Large Candles Form With Up Closes
Two conditions, both readable off the candles in front of you:
- Down-close candles are supporting price. When price pulls back into an old down-close candle and turns up from it, that candle is being used as support. That is a bullish order block doing its job — M5, at a scale you can see on the daily.
- Large candles form with up closes. The range-expansion is happening in the bullish direction. Expansion is M1’s first phase; this says which way it is expanding.
Mirror both for bearish. And note the second clause of the same line: ”& Or Price Has Recently Reacted Bullishly On A Discount Array” — the matrix rule from M8 counts as evidence of order flow all by itself.
3. Where are the arrays, relative to that range?
Only now do you mark arrays, and only relative to the range you just defined. This ordering is what stops you from marking twelve arrays and picking whichever one suits the trade you already wanted.
"Ideally Down Close Candles Support Price & Large Candles Form With Up Closes." What is this a definition of?
The gate: NEUTRAL is an output
Here is what makes this a procedure rather than an opinion, and it is the thing almost no retail teaching includes.
If The Above Condition Is Not True – 4Hour Is Neutral – Wait For The Opposing Conditions To Form Or The Above Conditions To Form. Sidelines For Now.
A timeframe that fails its own test does not pass a weak signal downward. It passes nothing. There is no partial credit, no “mostly bullish”, no “the daily is a bit choppy but I’ll take the 4H setup anyway.”
The consequence, stated plainly:
If the daily cannot hand the 4-hour a level, you do not trade today.
It costs nothing to apply, and it is aimed squarely at the trade you already know too well: the one taken because the lower chart looked clean while the chart above it had nothing to say. A day with no level is a finished day, not a missed one.
Monthly: bullish. Weekly: bullish. Daily: the range is unclear, no down-close candles are holding price, and there has been no reaction on a discount array. 4-hour: a textbook bullish order block with a clean structure break. What do you do?
You have run the cascade every day for a month and never once written NEUTRAL on any timeframe. What is the most likely explanation?
Carrying arrays down the cascade
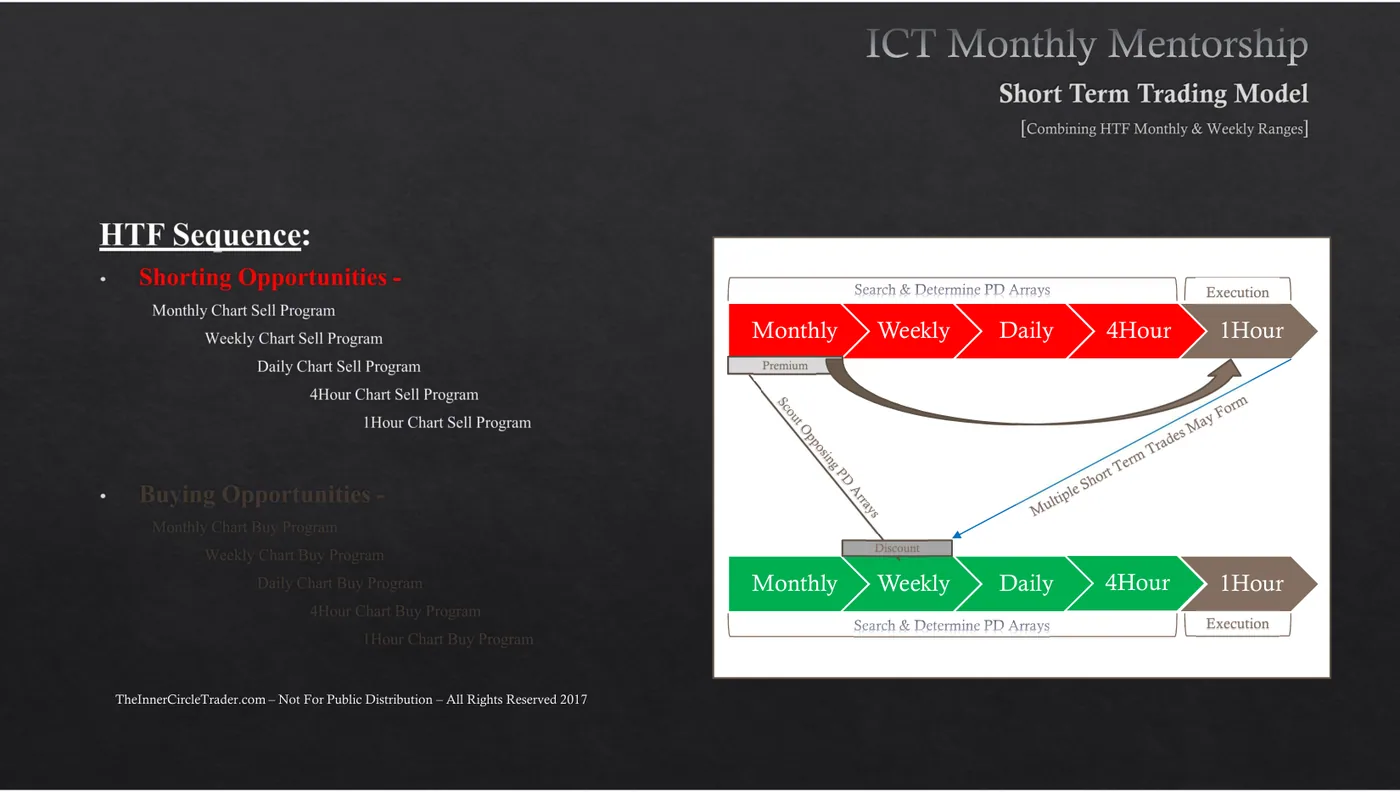
What travels down the cascade is not a feeling. It is a price.
- The monthly hands the weekly a bias and a range.
- The weekly hands the daily an array it is reaching for.
- The daily hands the 4-hour a specific level.
- The 4-hour hands the 1-hour the exact array inside that level.
- The 1-hour decides the moment.
At each step the receiving chart’s job is to refine, never to overrule. A 1-hour bullish order block inside daily premium is not a trade, however clean it looks — M8 said this and the cascade is where it bites.
The reason this is worth the effort: it shrinks the stop
Month 2 makes the risk argument for the whole procedure.
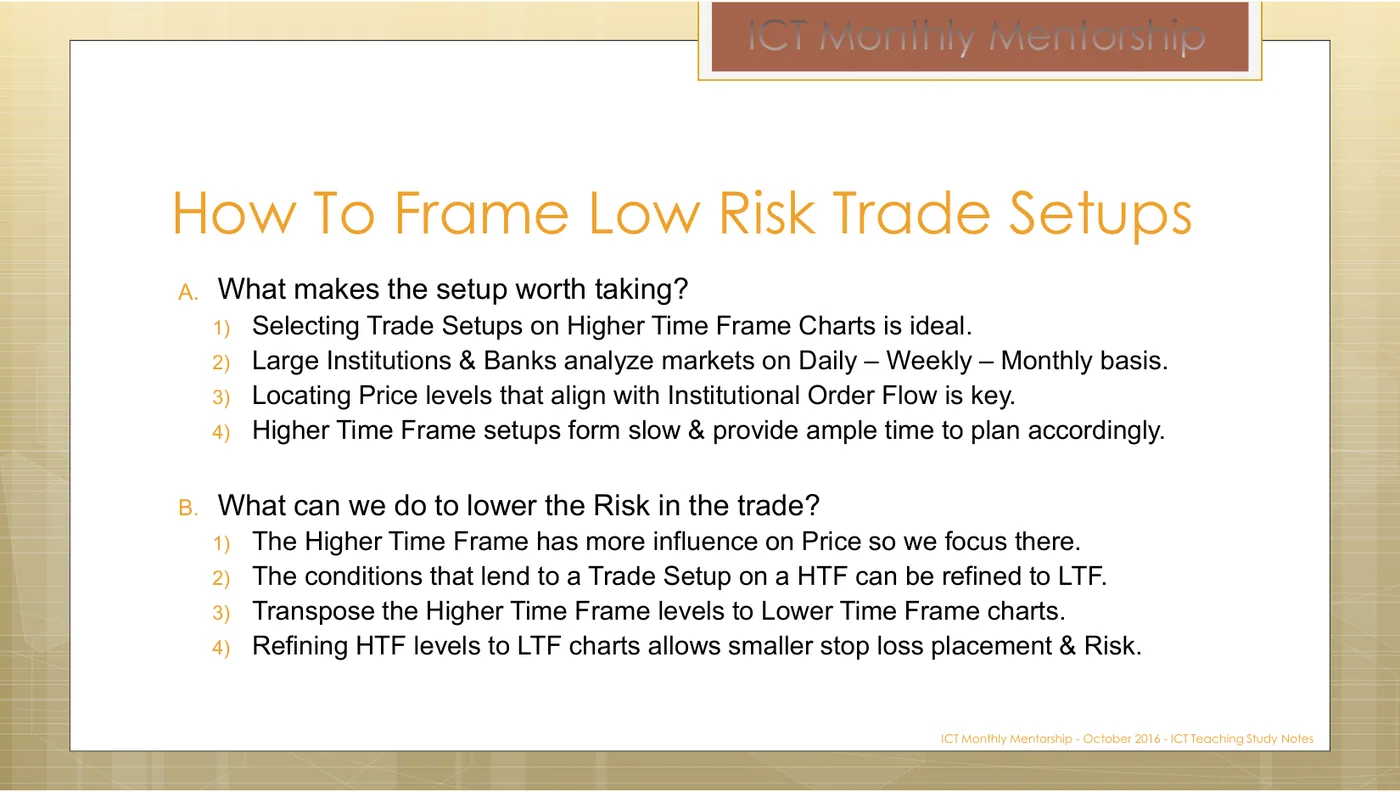
B. What can we do to lower the Risk in the trade?
- The Higher Time Frame has more influence on Price so we focus there.
- The conditions that lend to a Trade Setup on a HTF can be refined to LTF.
- Transpose the Higher Time Frame levels to Lower Time Frame charts.
- Refining HTF levels to LTF charts allows smaller stop loss placement & Risk.
This is the mechanism that makes 3:1 reachable, and it is worth being precise about because it is easy to get backwards:
You do not find the trade on the 1-hour. You find it on the daily and then express it on the 1-hour. The daily says “this discount array, this target”. The 1-hour lets you place the stop just beyond a 1-hour structure inside that daily array instead of beyond the whole daily candle. Same idea, same target, a fraction of the risk — and R is a ratio, so cutting the denominator does the same work as finding a better setup, without needing to be righter.
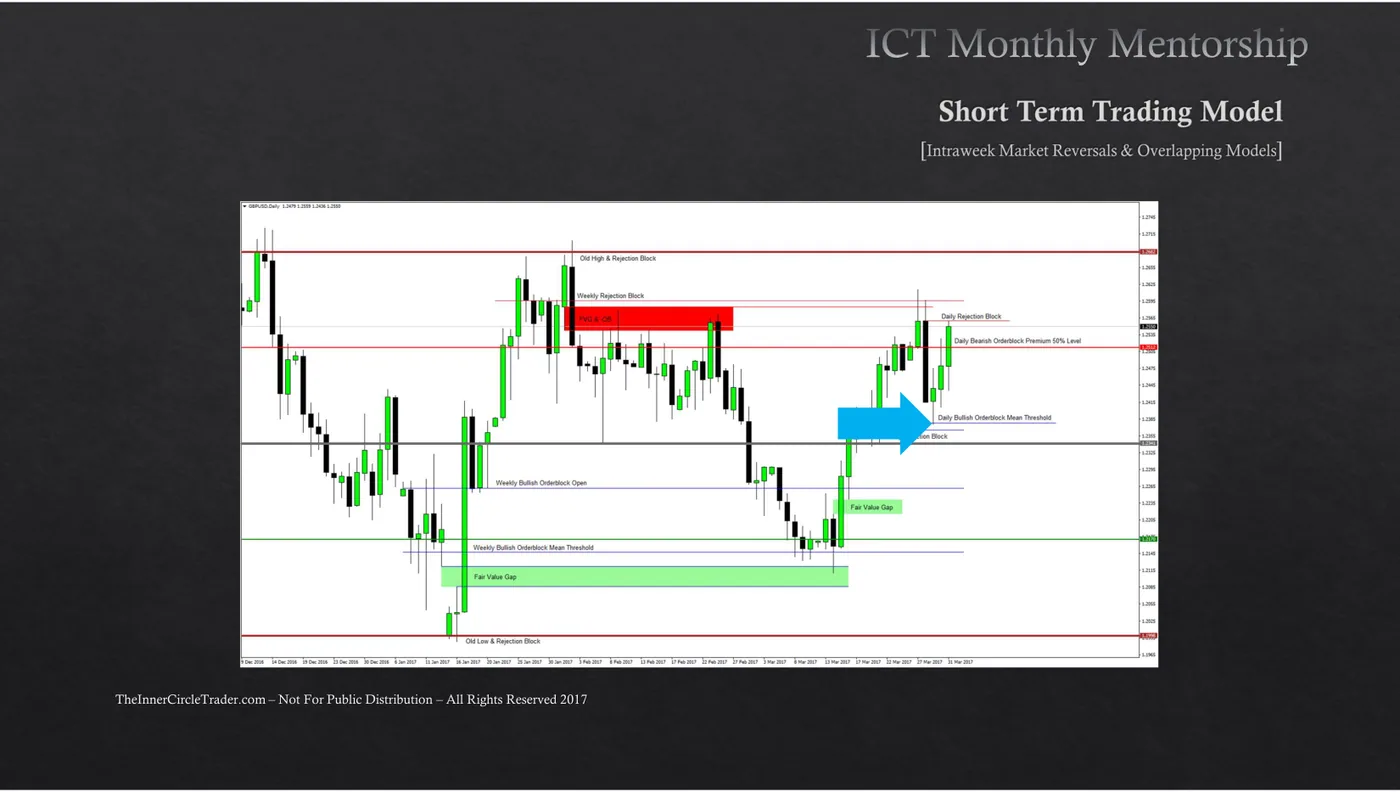
This is a weekly-scale chart before ICT has shaded anything. Box the region he treats as premium, and box the region he treats as discount. Two marks.
Drag a box around it. Marking nothing is a valid answer and is graded as one.
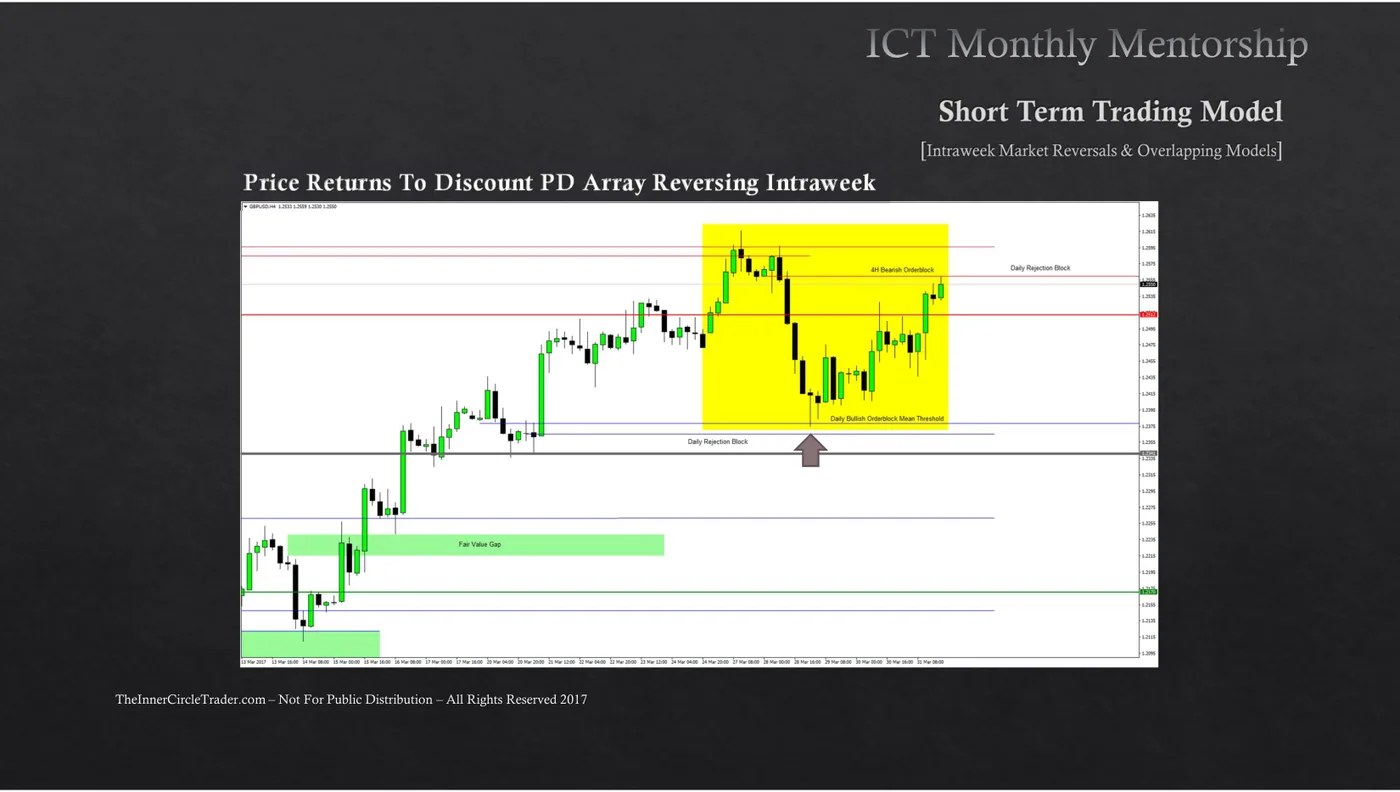
You have just run the weekly test on this pair and it came back NEUTRAL — no down-close candles supporting price, no recent reaction on a discount array. Mark the weekly PD array you will carry down to the daily chart.
Drag a box around it. Marking nothing is a valid answer and is graded as one.
Where to stop drilling down
Month 12 answers this by giving four complete setup templates, and the useful thing about them is that each one stops at a different chart.
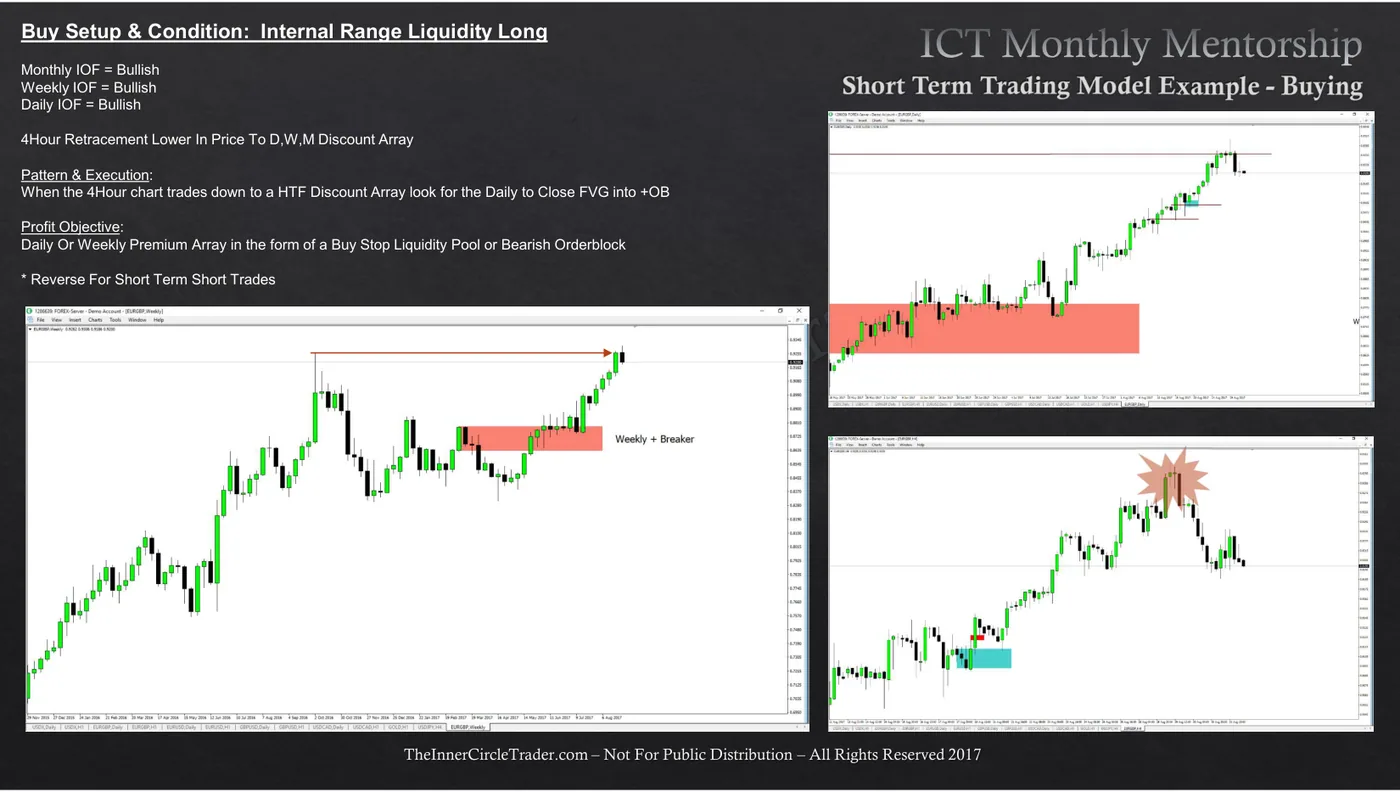
Buy Setup & Condition: Internal Range Liquidity Long Monthly IOF = Bullish Weekly IOF = Bullish Daily IOF = Bullish 4Hour Retracement Lower In Price To D,W,M Discount Array Pattern & Execution: When the 4Hour chart trades down to a HTF Discount Array look for the Daily to Close FVG into +OB Profit Objective: Daily Or Weekly Premium Array in the form of a Buy Stop Liquidity Pool or Bearish Orderblock
Compare the four. Two abbreviations: ERL is external range liquidity — the stops beyond the range’s high or low; IRL is internal range liquidity — the gaps and arrays inside the range. An ERL trade runs a pool first; an IRL trade retraces into an array first.
| Template | Timeframes that must agree | Retracement seen on | Entry pattern on | Objective |
|---|---|---|---|---|
| ERL short (p.97) | Monthly + Weekly bearish | Daily, into a D/W/M premium array | Daily sweeps a short-term high for buy stops, seen on 4H | Daily discount array |
| IRL long (p.98) | Monthly + Weekly + Daily bullish | 4H, into a D/W/M discount array | Daily closes an FVG into a bullish OB | Daily or weekly premium array |
| IRL short (p.99) | Weekly + Daily + 4H bearish | Hourly, into a 4H/D/W premium array | Daily bearish OB / OTE | Daily or 4H discount array |
| IRL long (p.100) | Daily + 4H + Hourly bullish | 15-minute, into an hourly/4H/D discount array | Hourly bullish FVG | Hourly premium array |
The pattern is exact and it answers the question:
You stop drilling down when the timeframes that agree run out. Three consecutive charts must agree on order flow; the next chart down is where you watch the retracement; the one below that is where you execute. Move the whole window up and you get a swing trade; move it down and you get a scalp. It is the same machine at four scales.
For your swing default that means: monthly + weekly + daily agree, retracement watched on the 4-hour, executed on the 1-hour, target on the daily or weekly. That is row two, and it is the template M14 will build your written model around.
Across Month 12's four setup templates, what actually changes from one to the next?
The 3:1 gate lives inside the cascade
The very next slide in the flowchart puts the reward filter in the same chain of “if not true — sidelines”:
Look For Opportunities To Frame 5:1 Reward To Risk Setups Or Minimum Of 3:1 Reward To Risk Setups – Discount Array Entry To Premium Array Exit Setups
If No Conditions Are Present To Frame 3:1 At Minimum – Sidelines For Now & Wait For More Developments in Price
Note the phrasing of the first line: discount array entry to premium array exit. The reward ratio is not something you hope for after entering — it is a measurement between two arrays you have already identified, which means you can compute it before you place anything. If the arithmetic does not reach 3:1, the setup fails here and nothing later can rescue it. M13 makes this the centre of everything.
"Discount Array Entry To Premium Array Exit Setups" — why does that phrasing matter for the 3:1 filter?
What this course does not carry down, and what that costs
Month 12’s full chain has steps this course cannot honestly teach you to execute daily, and pretending otherwise would be the exact overwhelm you came here to escape.
Once Bullish Institutional Order Flow Is Determined – Refer To The Commercial Hedgers In Commitment Of Traders Report
Determine If Commercials Are Net Long Or Net Short For Asset Under Analysis
If Net Long – Odds Increase For Long Positions
Month 12's full chain includes COT commercial hedging, intermarket confirmation, the interest-rate triad and retail sentiment between 'order flow is bullish' and 'look for discount arrays'. This course does not build them in. Which of these are honest statements about that? (Select all.)
The decision rule
- When
- You are framing a trade idea and need to know whether there is one at all.
- Then
- Run the same three-part test down the chain — range → order flow → arrays — starting at the monthly. Each timeframe that passes hands a specific price to the one below it. Stop when three consecutive timeframes agree; watch the retracement on the next chart down, execute on the one below that, and target an array in the opposite half of the highest chart that agreed.
- Otherwise
- The moment a timeframe fails its own test, that timeframe is neutral and hands down nothing. If the daily cannot hand the 4-hour a level, there is no trade today — write NEUTRAL and close the laptop. If the arithmetic between your entry array and your target array does not reach 3:1, the setup fails here regardless of how good it looks.
Homework
One pair, five timeframes, written before the week starts
Set the replay up
- Pick a Monday at least three months back. Bar Replay to Sunday's close.
- Open five chart tabs at the five timeframes, all on the same pair.
- Have the gating table from this module open beside you.
Then, bar by bar
- Monthly: is order flow bullish, bearish, or neutral? If neutral, write NEUTRAL and carry nothing down.
- Weekly: same question, and name the array the weekly is reaching for.
- Daily: same question. Now name the specific level the daily hands the 4H.
- 4H: locate the array inside that level. Write its exact price.
- 1H: state what would have to happen for you to act, and by when.
- Then step the replay forward one week and score your own writeup against what happened.
Self-assessment — tick only what is honestly true
Done with M10?
Mark it complete only if you could teach the decision rule to someone else without scrolling back up. Completion is stored in this browser.