Time Is a Variable, Not a Filter ★
Swing timing first — the weekly profile, day-of-week, HTF array timing — then the intraday track: Asian range, killzones, the Judas swing and PO3.
“The same order block at 03:00 and at 08:00 are not the same trade. Time is half the setup.”
The half of the setup you have been leaving out
Every module up to here has been about price: where the arrays are, which half of the ladder you shop from, what validates and what doesn’t. You can now look at a chart and name the level.
And you will still lose, more or less randomly, until you add the other input.
Your library treats time as co-equal with price, not as a filter applied to price. Month 7 has a recurring slide whose only content is two words:
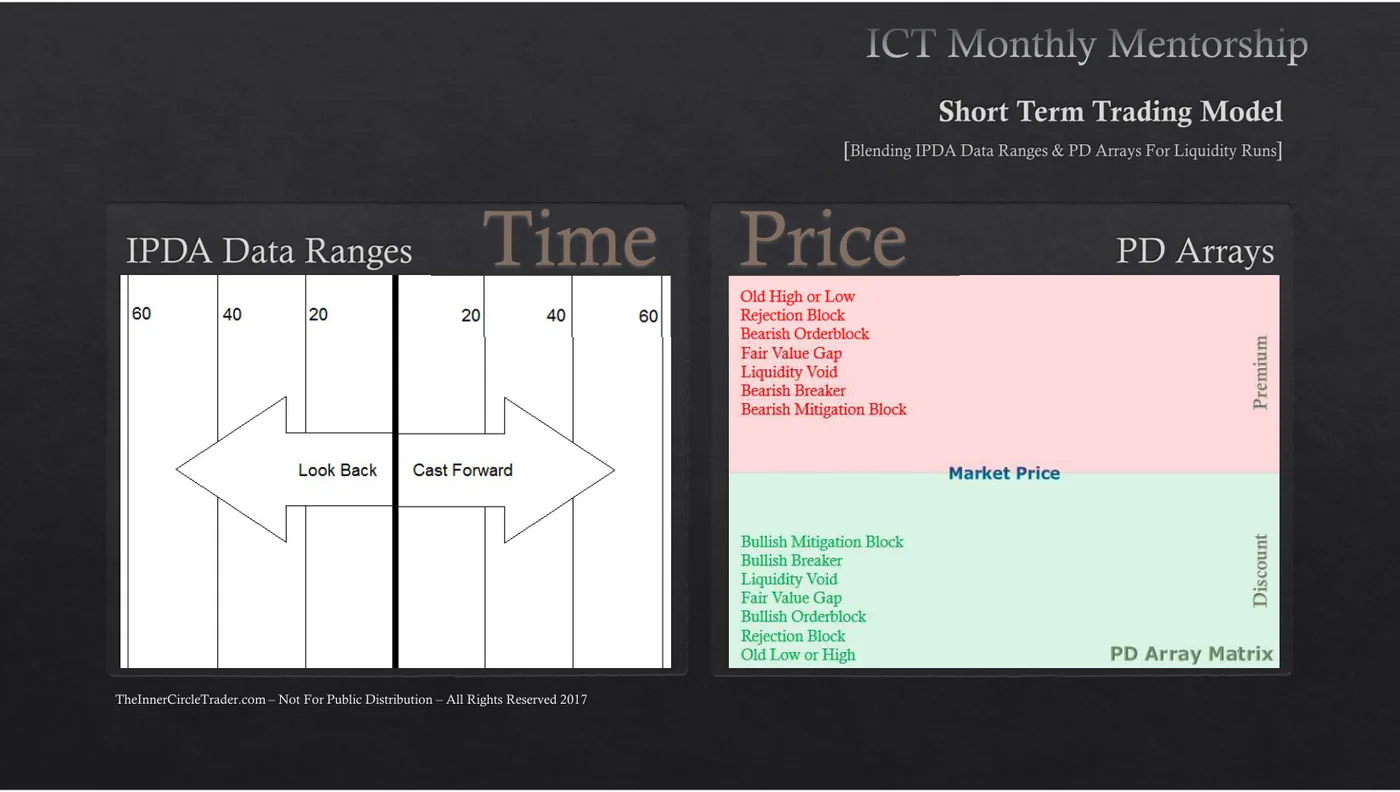
And Month 8 is titled, in full, Using the PD Array Matrix with Time & Price Theory — the matrix you learned in M8 was never meant to be read without a clock beside it.
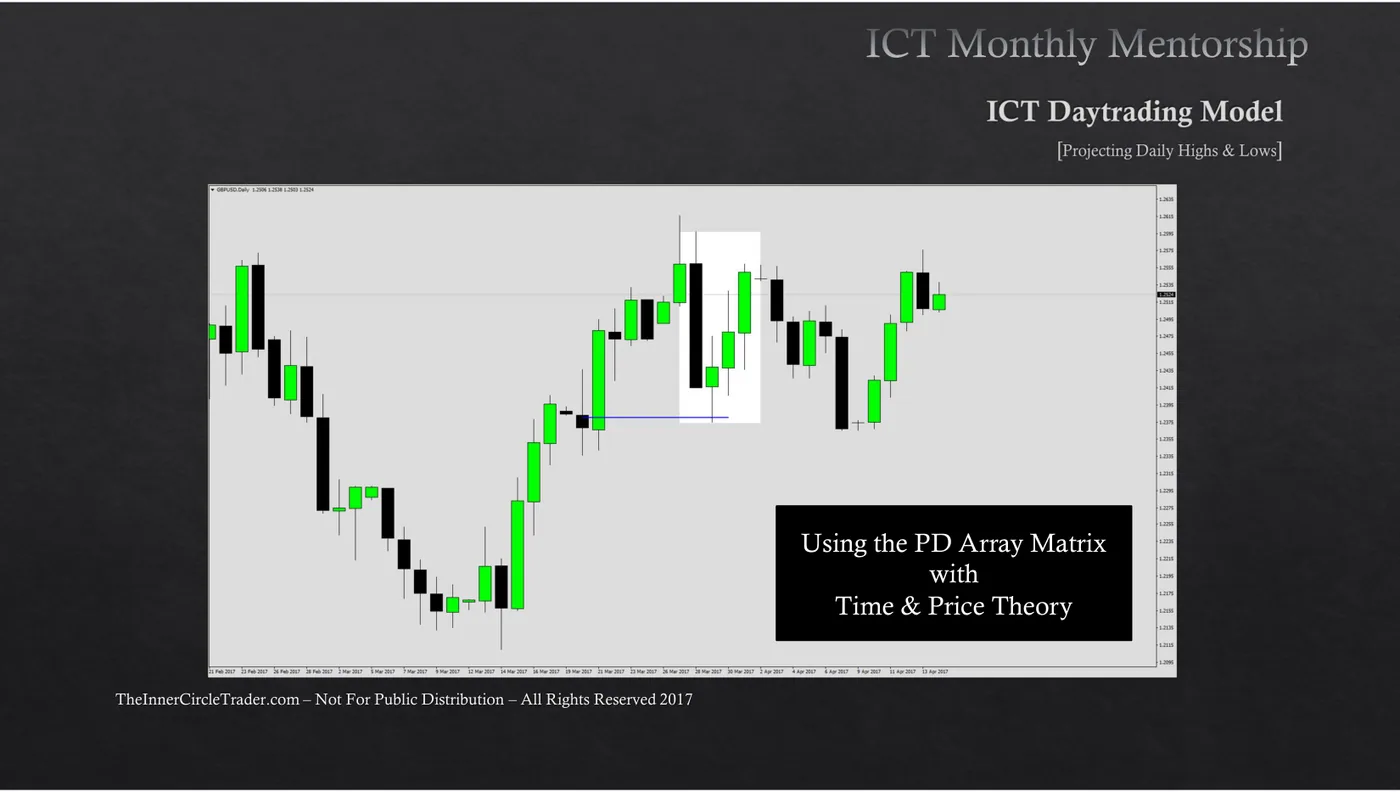
The claim of this module: an array at one moment and the identical array at another are two different trades, and the difference is large enough to explain results that currently look random to you.
Here is that claim as a moving picture, followed by both clocks. The first scene is a schematic, not a backtest: two versions of one level, drawn to show what the clock changes.
Transcript
- The same discount array, reached at two different hours.
- At 03:00 GMT price drifts through it. At 07:30 it sweeps the Asian low into it — and leaves with force. (Schematic, not a backtest.)
- Same level. Different hour. Different trade.
- Swing clock: the unit is the week. First, the higher timeframe gives you a direction.
- ICT’s weekly profile: the week’s low typically forms Monday to Wednesday — here, at a discount array.
- Then the week travels to the opposite-half array. One array to another, in about a week.
- Entries cluster early in the week; management runs late. Missed the window? Usually, do nothing.
- Intraday clock: Asia, 00:00–05:00 GMT, builds a range. Study it, don’t trade it.
- London killzone (07:00–09:00 GMT): the Judas swing runs the Asian low’s stops — the wrong way first.
- With a bullish bias, that sweep is your entry, not your stop-out. Then profit release. Unfilled by 11:00 — the setup expired.
- Hold into New York. Flat by 18:00 GMT. Power of three: accumulate, release, distribute.
- The clock rule: an array only becomes a trade inside its window. Outside the window — no trade. Log the day; it counts.
You take the same bullish order block twice on the same pair. The first time it does nothing for eleven hours and then fails; the second time it moves immediately. The array was valid both times. What changed?
Two clocks, and yours is the slow one
Your library contains two complete timing models. They are not in conflict — they are the same idea at two speeds.
| The swing clock (your default) | The intraday clock | |
|---|---|---|
| Unit | The week | The day |
| Question | Which day does this week’s extreme form on? | Which hour does today’s extreme form on? |
| Source | Month 7’s weekly profile, Month 6’s swing model | Asian range, killzones, Judas swing, PO3 |
| Screen time | ~30 min/day at any hour | A specific 2-hour window, 4 days a week |
| Holds | Days | Hours |
You were profitable swing trading in 2023. That is not a small detail — it is evidence about which clock fits your life and your temperament, and it is the reason this course teaches the swing clock as the primary model and the intraday clock as the second track. Everything in Tiers 1 and 2 applies identically to both. Only the clock changes.
The swing clock, part 1 — the week has a shape
Here is the single most useful timing fact in your entire library for the way you trade, and it is one sentence on one slide:
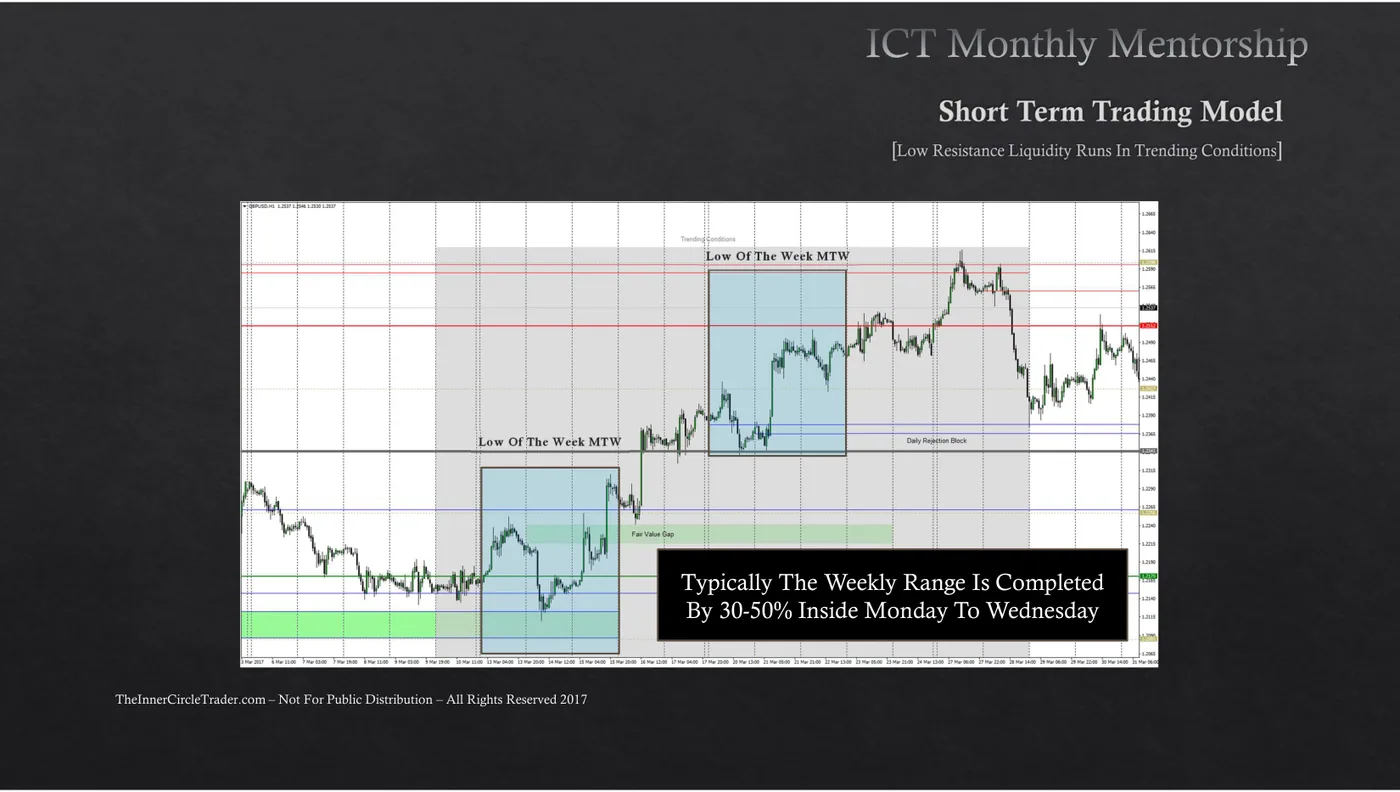
Typically The Weekly Range Is Completed By 30-50% Inside Monday To Wednesday
Read that as an instruction rather than a statistic, because that is what it is worth. If the week is going to make a low and rally, the low is most likely already in by Wednesday’s close. If you are hunting a long, you are hunting it Monday to Wednesday. If it is Thursday and you have no position, the highest- value thing you can do is usually nothing.
ICT states the corresponding action directly:

Using the previous Daily, Weekly and Monthly analysis – I look for reasons to trade in that HTF Directional Bias.
If I am Bearish from the HTF – I look for Shorts on Mondays, Tuesdays and Wednesdays.
If I am Bullish from the HTF – I look for Longs on Mondays, Tuesdays and Wednesdays.
If I am expecting the MTW influence and it does not materialize – I look for late week scenarios on Thursday or Friday. The Economic Calendar will assist in this.
Three things fall out of that, and all three are executable tomorrow:
1. Direction comes first, day comes second. (HTF = higher timeframe: the daily, weekly and monthly charts that set your bias — M10 makes this a procedure.) The day-of-week rule does not tell you what to do — it tells you when to look for what the higher timeframe already told you to do. Without an HTF bias, day-of-week is noise.
2. Monday–Wednesday is the window for entries in the direction of the bias. Not a hard prohibition on Thursday, but a strong default. Your entries cluster early in the week; your management runs late in it.
3. If MTW does not deliver, that is information, not an invitation. ICT’s own fallback is “late week scenarios” with the calendar consulted — which is a much narrower permission than “trade Thursday because I haven’t traded yet.”
It is Tuesday. Your higher-timeframe work says bullish and price has just reached a daily discount array. According to Month 12's day-of-week slide, what does the day of the week contribute?
It is Thursday morning. You are bullish from the daily, the week has not made the low you expected, and you have no position. What does this module say to do?
The swing clock, part 2 — a week is one array to another
The weekly profile has a companion slide that connects it straight back to M8:
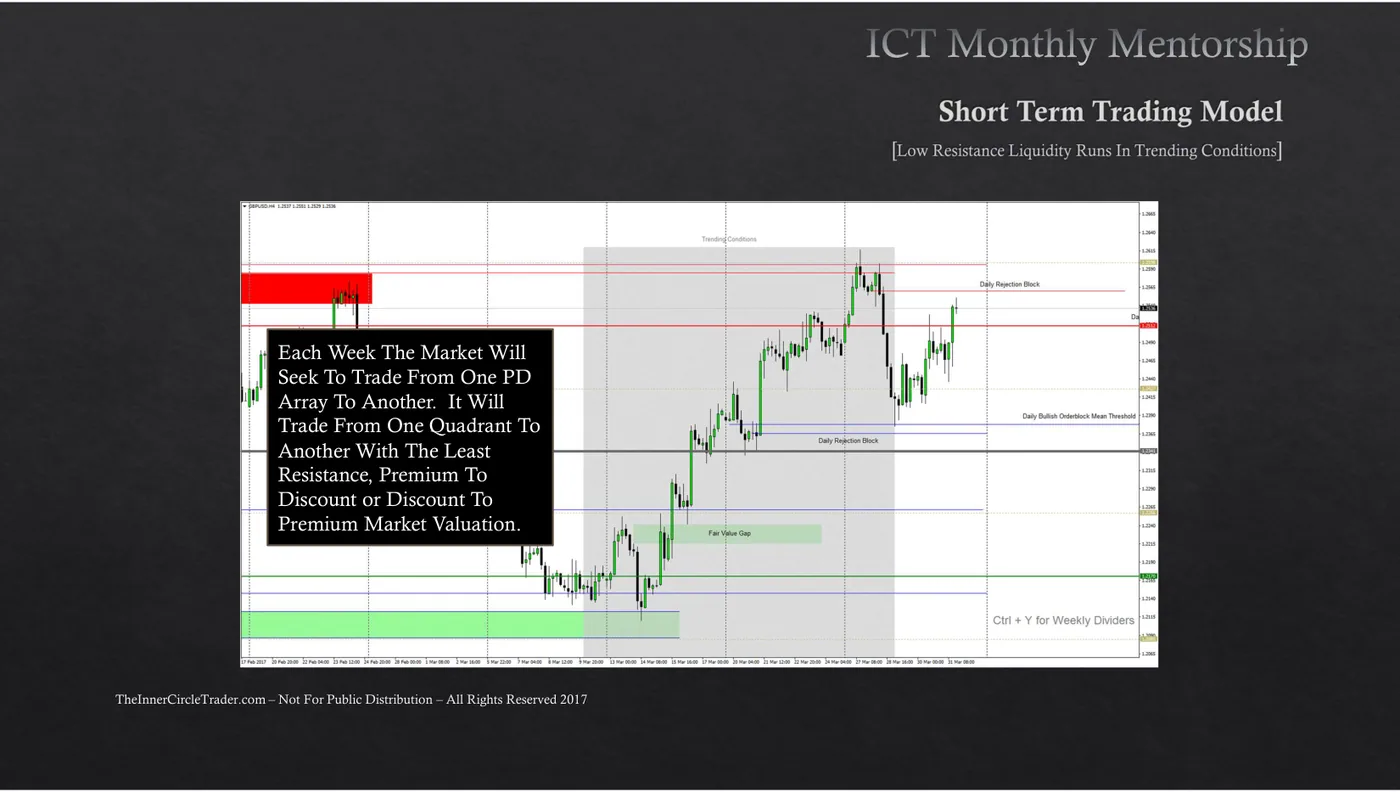
Each Week The Market Will Seek To Trade From One PD Array To Another. It Will Trade From One Quadrant To Another With The Least Resistance, Premium To Discount or Discount To Premium Market Valuation.
This is the M8 rule with a deadline attached. The matrix told you price alternates between halves. This tells you the alternation has a natural period — about a week — and that the low-resistance path is the one it takes.
So the swing trade has a shape you can state before it happens: the extreme forms Monday to Wednesday at a discount array (if you are bullish), and the week spends the rest of itself travelling to a premium array. Your entry is the array; your target is the opposite-half array; your window is the week; your invalidation is the week failing to leave the half it started in.
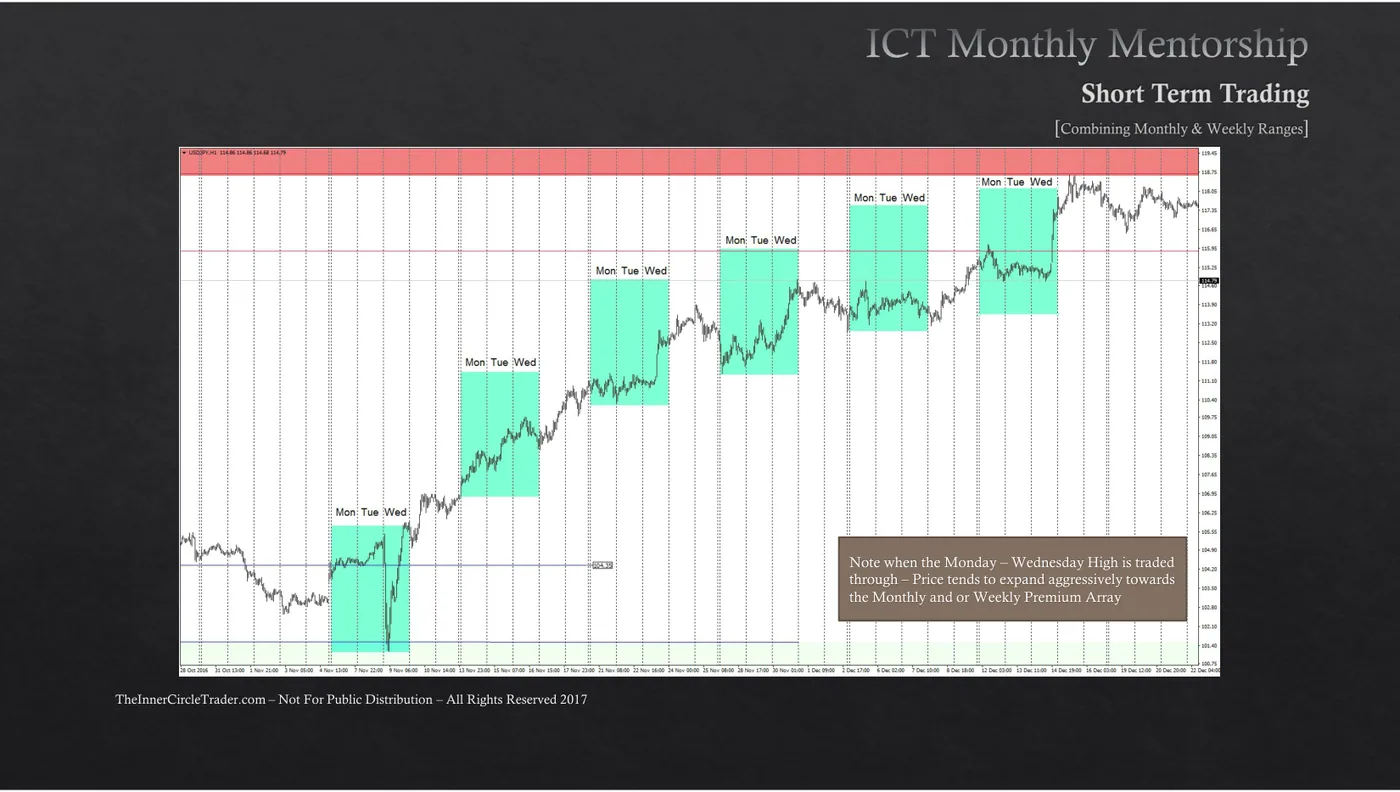
Note when the Monday – Wednesday High is traded through – Price tends to expand aggressively towards the Monthly and or Weekly Premium Array
"Each Week The Market Will Seek To Trade From One PD Array To Another. It Will Trade From One Quadrant To Another With The Least Resistance." What does this add to the M8 matrix rule?
Mark it yourself
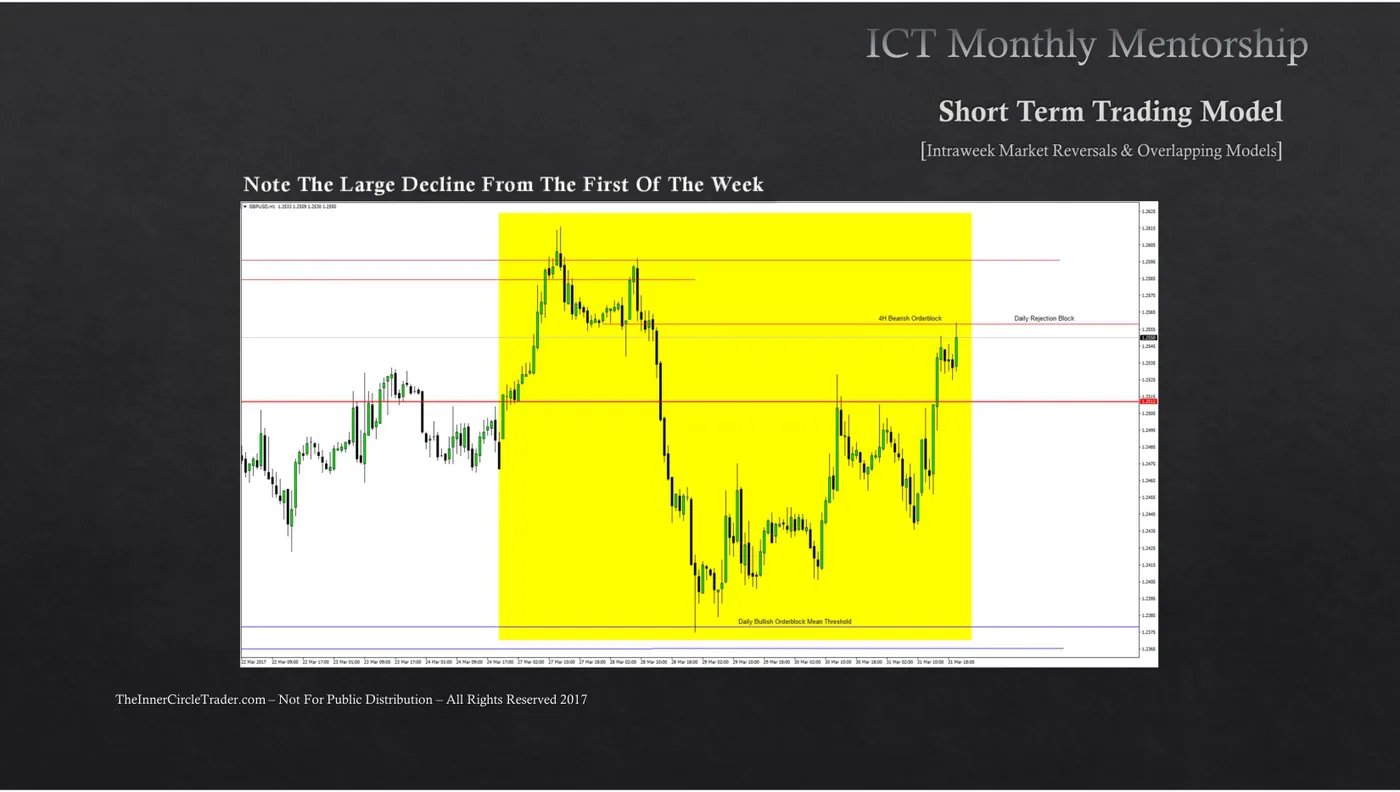
ICT has boxed one full trading week in yellow on this chart. Box the Monday-to-Wednesday portion of it — the window in which the week's extreme is expected to form.
Drag a box around it. Marking nothing is a valid answer and is graded as one.
Mark the London killzone on this chart — the 07:00–09:00 GMT window. If it cannot be marked here, mark nothing and submit.
Drag a box around it. Marking nothing is a valid answer and is graded as one.
The swing clock, part 3 — the layer above
Two slides worth holding lightly, because they set the outer boundary:
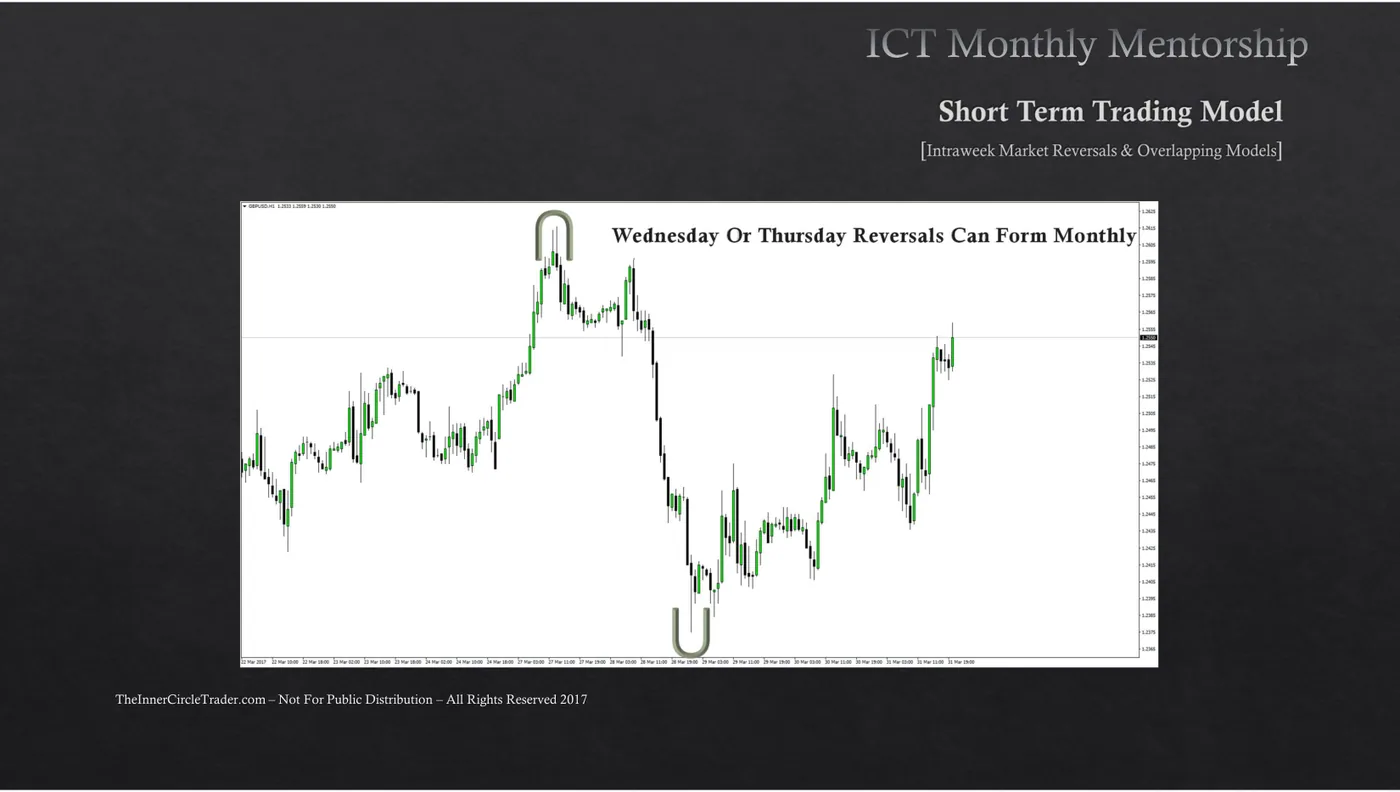
A Wednesday reversal is not only this week’s turn — sometimes it is the month’s. That is the argument for having the monthly and weekly arrays marked before the week opens: when the mid-week reversal lands on one, you are looking at a much larger move than a weekly rotation, and the target you name should reflect it.
The practical version, which M10 turns into a procedure: mark the monthly and weekly arrays at the weekend, mark the daily range on Sunday night, and let the week come to them.
The intraday clock — the second track
Everything below is real, is fully in your library, and is the model
STRATEGY_DELIVERABLE.md is built on. It is second here because of your
timezone and your history, not because it is lesser. If you ever want to day
trade, this is the complete timing spec.
The Asian range is a study, not a session
The Asian Range is 0:00GMT - 5:00GMT.
Study this time of the day more than trading it.
The Asian Range determines the directional bias or likely direction for the majority of the London & New York sessions.
Always extend the Asian Range high and low throughout the day. It can provide you an opportunity to trade if price should make its way back to that level of support and/or resistance.
The Asian range is a consolidation — M1’s fourth phase — and its extremes are therefore stop pools, which is M2. It is not a new concept; it is the two you already have, given a clock time. And ICT’s instruction is explicitly not to trade it.
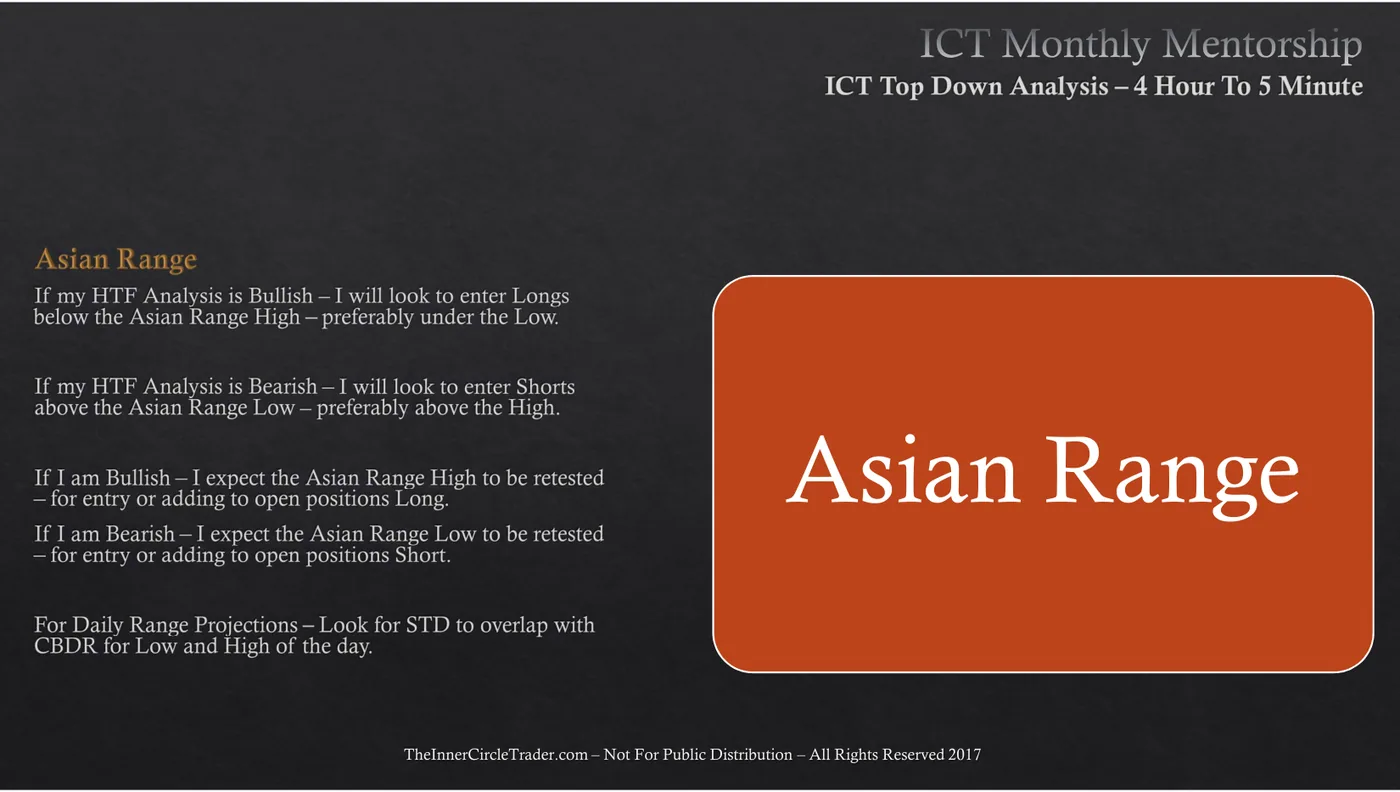
If my HTF Analysis is Bullish – I will look to enter Longs below the Asian Range High – preferably under the Low.
If my HTF Analysis is Bearish – I will look to enter Shorts above the Asian Range Low – preferably above the High.
If I am Bullish – I expect the Asian Range High to be retested – for entry or adding to open positions Long.
If I am Bearish – I expect the Asian Range Low to be retested – for entry or adding to open positions Short.
Note what that says: if you are bullish, you want to be filled below the Asian range low — that is, on the sweep, not on the breakout. Which is the next concept.
The Judas swing
Judas Swing: an “engineered” price swing meant to lead reactionary traders into the wrong direction.
It is typically a false rally higher that appears initially to emotional traders as the next big run in price. Many traders follow the Judas Swing and find themselves trapped on the wrong side of the market.
The Judas Swing is essentially a stop raid move that surges in one direction and many times trades right into: Key S/R level Previous high or low Counter-swing to form OTE Raid of the previous week high Raid of the previous week low Raid of the previous session stops
When we have the probable direction on the overall trading day, we actually wait for the Judas Swing to lead the “street money” to us.. for the kill.
Read that clause carefully: “When we have the probable direction on the overall trading day.” The Judas swing is not a standalone signal. It is what you wait for once you already have a bias — which is the daily’s job, which is M10’s job. Without the bias, a Judas swing and an ordinary breakout are indistinguishable in real time, and you will take the wrong side of it. Again.
Price surges up out of the range, takes out yesterday's high, and reverses hard. Judas swing?
Killzones and the true day
A killzone is simply a named window of hours in which ICT expects the day’s decisive move to start. The two that matter here are London (07:00–09:00 GMT) and the New York open.

Utilizing the HTF Analysis – I will look for a trade setup in the London Open Killzone. I aim for the Low of the day when the HTF is Bullish. If I fail in London – I look for a New York Open setup to reposition or get position.
I look to collapse the bulk or all my intraday positions starting in the 10:00 am to 11:00 am NY time window.
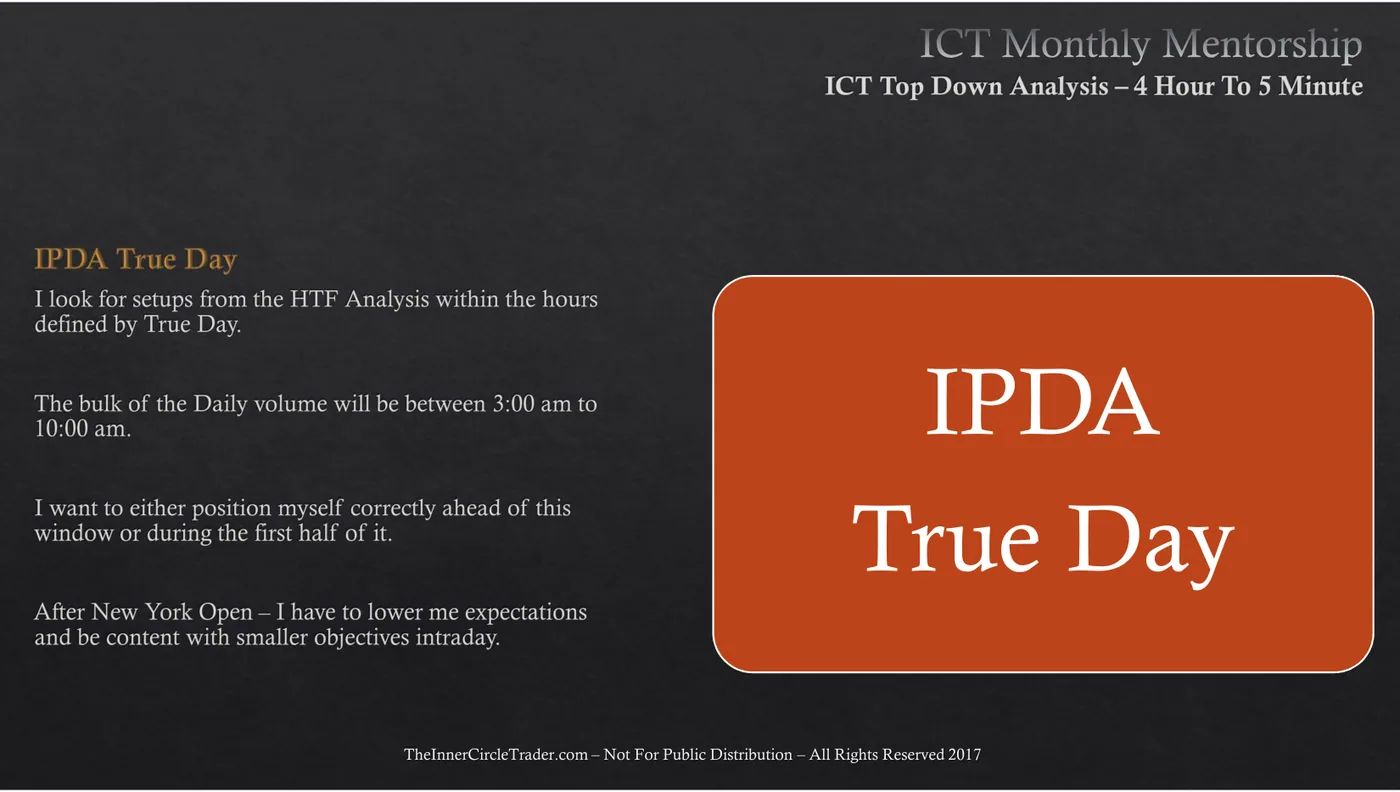
I look for setups from the HTF Analysis within the hours defined by True Day.
The bulk of the Daily volume will be between 3:00 am to 10:00 am.
I want to either position myself correctly ahead of this window or during the first half of it.
After New York Open – I have to lower me expectations and be content with smaller objectives intraday.
The clock, consolidated — GMT, with your local time shown on the routine page:
| GMT | What it is | What you do |
|---|---|---|
| 00:00–05:00 | Asian range | Mark the box. Do not trade it. |
| 06:00 | Bias check | Long, short, or none. None means close the laptop. |
| 07:00–09:00 | London killzone | The primary window. The Judas swing lives here. |
| 11:00 | Cut-off | Unfilled orders cancelled. The setup expired. |
| 12:00–15:00 | New York open | Continuation or repositioning only. |
| 15:00–17:00 | London close | Tighten. Counter-trend reactions are common here. |
| 18:00 | Flat | The daily range is typically done. |
Power of three, and the discipline it teaches
Power of three (often shortened to PO3) is ICT’s name for the three phases that fill a day’s range:
There are 3 major market cycles and they are:
- The Accumulation Phase: Smart money is accumulating longs or shorts.
- The Profit Release Phase: Range expansion move where profit is permitted.
- The Distribution Phase: Smart money is distributing longs or shorts that it previously accumulated.
To make serious money in this business, you need to have an understanding on how the daily range is filled. It is time & price theory based. You want to hold for AT LEAST the New York Open which is 12:00GMT time. The second profit objective in terms of time is 15:00GMT, approximately London Close. The last profit taking time for day trading inside the daily range is 18:00GMT.
Those three phases are M1’s cycle at day scale — accumulation is consolidation, profit release is expansion, distribution is the reversal that sets up the next one. Nothing new, one more time.
And the sentence that carries the behavioural lesson for both clocks:
Don’t watch for pips or price, just watch the time. Once you enter a trade and set a stop loss, all you need to do is wait time for it to move.
For the swing model, substitute the unit: once the position is on with the stop where you wrote it, the thing you are waiting for is Wednesday, not a tick.
Month 12: "If my HTF Analysis is Bullish – I will look to enter Longs below the Asian Range High – preferably under the Low." Why under the low?
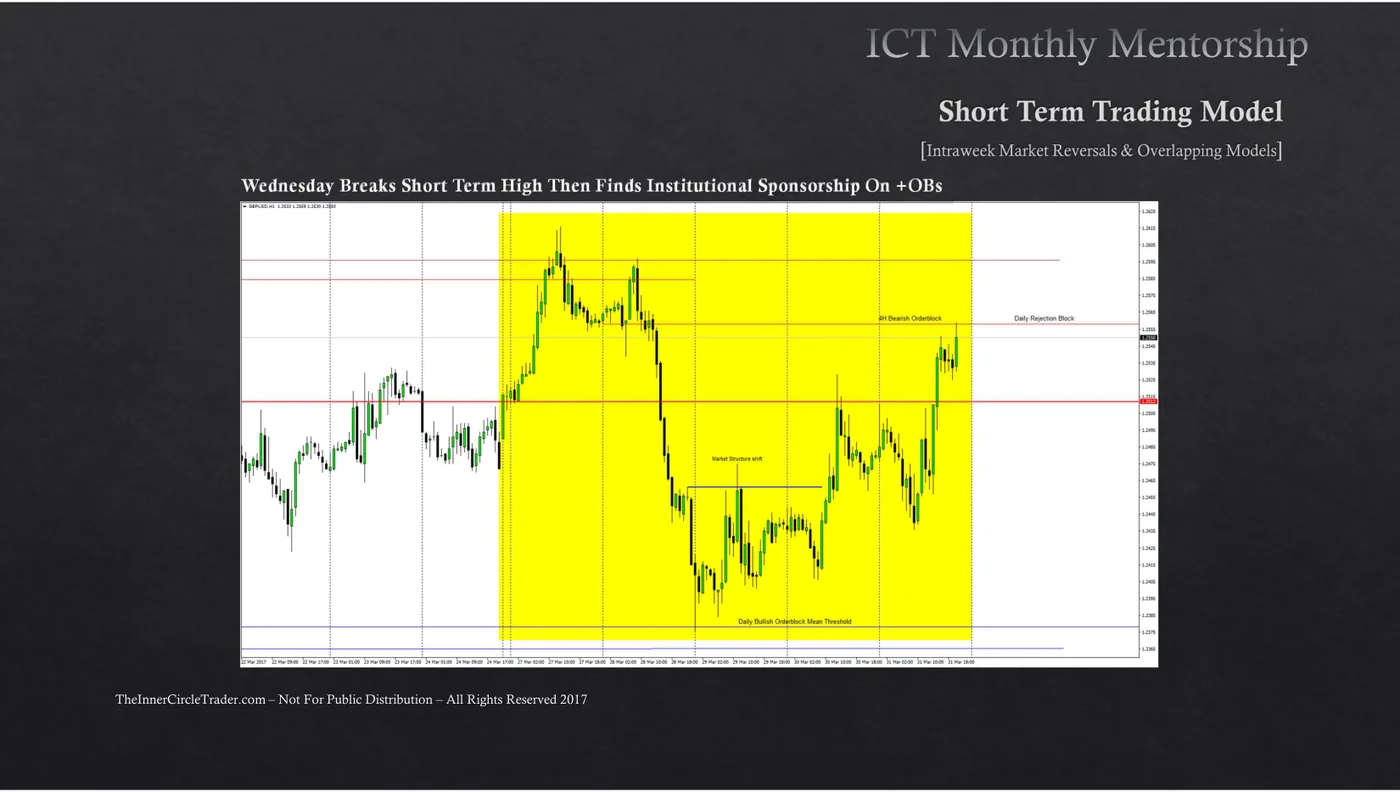
This week broke a short-term high on Wednesday and then came back down. ICT's caption says it 'finds institutional sponsorship on +OBs' on the way back up. Before revealing: mark where you think those bullish order blocks are.
When the clock says stand down
The whole module compresses to four disqualifications. Each one is a complete answer.
- No HTF bias. Day-of-week and killzones both begin “utilizing the HTF analysis”. Without it there is nothing for the clock to schedule.
- Wrong part of the week for the direction you want. Bullish, and it is Thursday with no position: the MTW window has passed. ICT’s own fallback is narrow and calendar-aware, not “trade anyway”.
- The window closed unfilled. Intraday: 11:00 GMT and the limit did not fill. Swing: the week ended without reaching your array. Both are expiry, and an expired setup did not get better by waiting.
- You are trading the Asian range. “Study this time of the day more than trading it.” If you are placing orders between 00:00 and 05:00 GMT you are trading the consolidation, which is the one phase with no directional edge.
Select every situation in which this module says stand down. (More than one is correct.)
The decision rule
- When
- You have an HTF bias and a valid array from the matrix, and you are deciding whether to act now.
- Then
- Swing: act only if it is Monday to Wednesday and the array sits in the half your bias says you shop from; hold for the week's opposite-half array and manage on daily closes. Intraday: act only inside 07:00–09:00 GMT (or 12:00–15:00 to reposition), on the sweep of a pool rather than the breakout, flat by 18:00.
- Otherwise
- Do nothing and log the day. Outside the window, the same array is a different trade and you do not have an edge you can name. A logged no-trade day is a completed day.
Homework in the tool you actually trade in
Call the low (or high) of the week before Wednesday closes
Set the replay up
- Pick a start date at least six months back so you have no memory of the week.
- Turn on Bar Replay and step to the Monday open of that week.
- Ctrl+Y in TradingView draws the weekly dividers — ICT uses them on his own slides.
- Before you step a single bar: mark the daily dealing range you are measuring from, its equilibrium, and the external liquidity above and below.
Then, bar by bar
- Write down, in one sentence, whether you expect the week to make its low or its high first, and why — which half of the matrix has just been worked.
- Step forward one daily bar at a time through Monday, Tuesday and Wednesday.
- At each close, note whether the extreme you predicted has printed yet.
- Stop at Wednesday's close. Write down the actual Monday-to-Wednesday high and low.
- Now step through Thursday and Friday and see whether the week held that extreme or made a new one.
Self-assessment — tick only what is honestly true
Find the Judas swing on twelve consecutive days
Set the replay up
- Set the chart timezone to GMT so the killzone times on this page match what you see.
- Bar Replay from 00:00 GMT on a Monday at least three months back.
- Draw the Asian range box each day: 00:00–05:00 GMT, high to low.
- Shade 07:00–09:00 GMT — the London killzone.
Then, bar by bar
- At 06:00 GMT, write the day's bias in one word: long, short, or none.
- Step to 09:00 GMT. Mark the move that went against your bias and took a pool — that is the candidate Judas swing.
- Note the time it reversed, and which pool it ran (Asian high, Asian low, previous day high or low).
- Step to 18:00 GMT and record where the day actually closed relative to that swing.
- Repeat for twelve consecutive trading days.
Self-assessment — tick only what is honestly true
Done with M9?
Mark it complete only if you could teach the decision rule to someone else without scrolling back up. Completion is stored in this browser.