Breakers, Mitigation & Rejection Blocks
Buyer's remorse as the single mechanism behind all three, and the structural break that tells you which one you are looking at.
“These aren't three more patterns. They're one idea — where are the trapped traders, and what price lets them out — seen at three different moments.”
Three names, one mechanism
Breaker block. Mitigation block. Rejection block. Three more objects to memorise — which is exactly the framing that made 471 PDFs unlearnable.
They are not three objects. They are one question asked at three different moments:
Where are the traders who are trapped on the wrong side, and what price lets them out?
That is the whole module. Everything below is the same idea seen at three distances, and ICT gives the mechanism its own two-word name on his own slides:
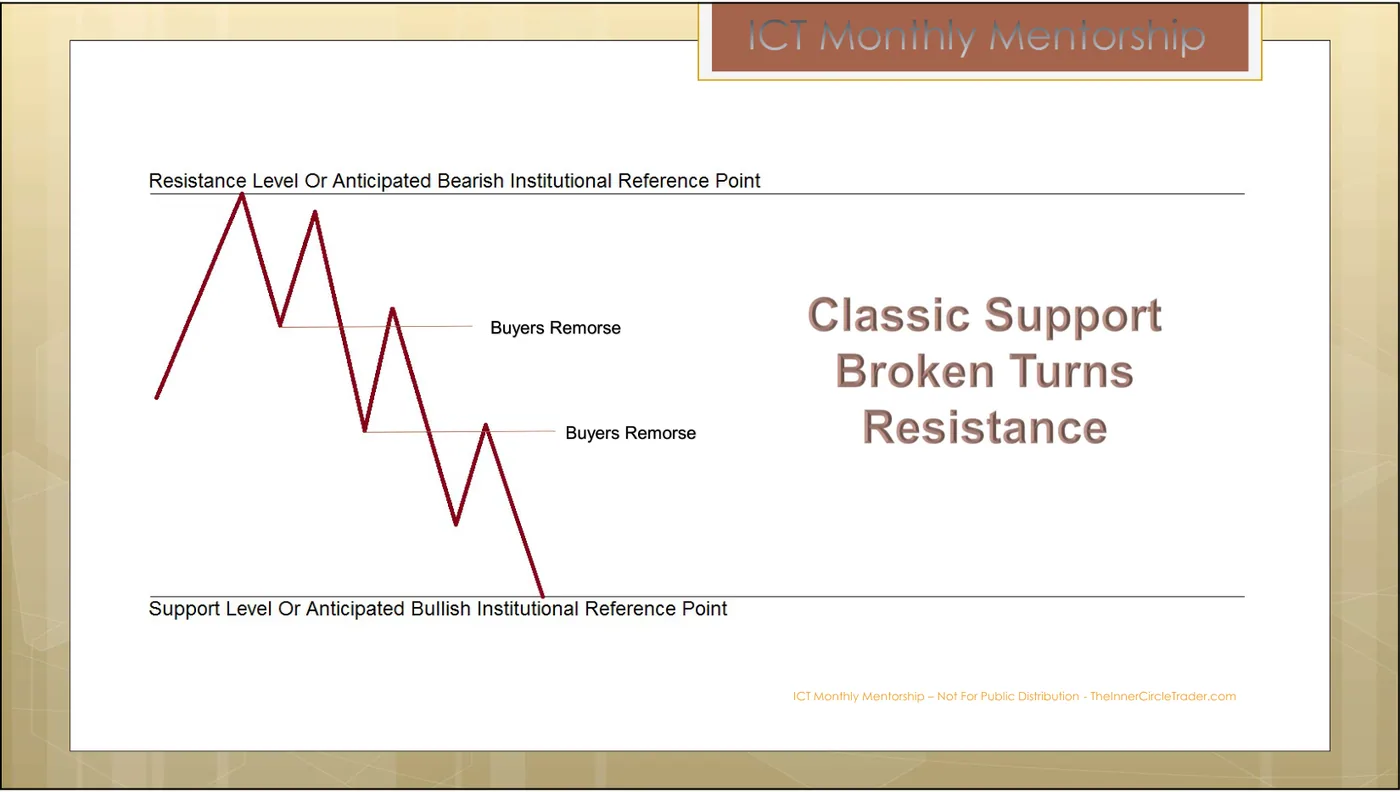
Buyer’s remorse. Somebody bought, price went against them, and the moment price comes back to where they got in, the pressure to get out flat is enormous. Those exit orders are supply. Supply at a known price is a level you can trade against.
Watch it happen once before any definitions. This is a bearish breaker, but pay attention to the panel on the right, not the name: it shows how the people who bought the swing low feel at each step.
Transcript
- Price makes a high. Stops rest just above it — buy-side liquidity.
- Traders buy the swing low. Price rallies. They feel right.
- Price runs above the old high and the buy stops are taken. That was the fuel.
- Price falls back through their entry. Everyone who bought the swing low is now trapped.
- The swing low they bought is now a marked level: the bearish breaker.
- Back at their entry, they sell to get out flat. That selling is supply.
- You sell with their exits. Stop above the block — if price holds above it, the idea is wrong.
- The one question: where are the traders trapped on the wrong side — and what price lets them out? Nobody trapped means no trade.
Moment one · The mitigation block
The simplest case: no structural break required, just a leg that trapped people.
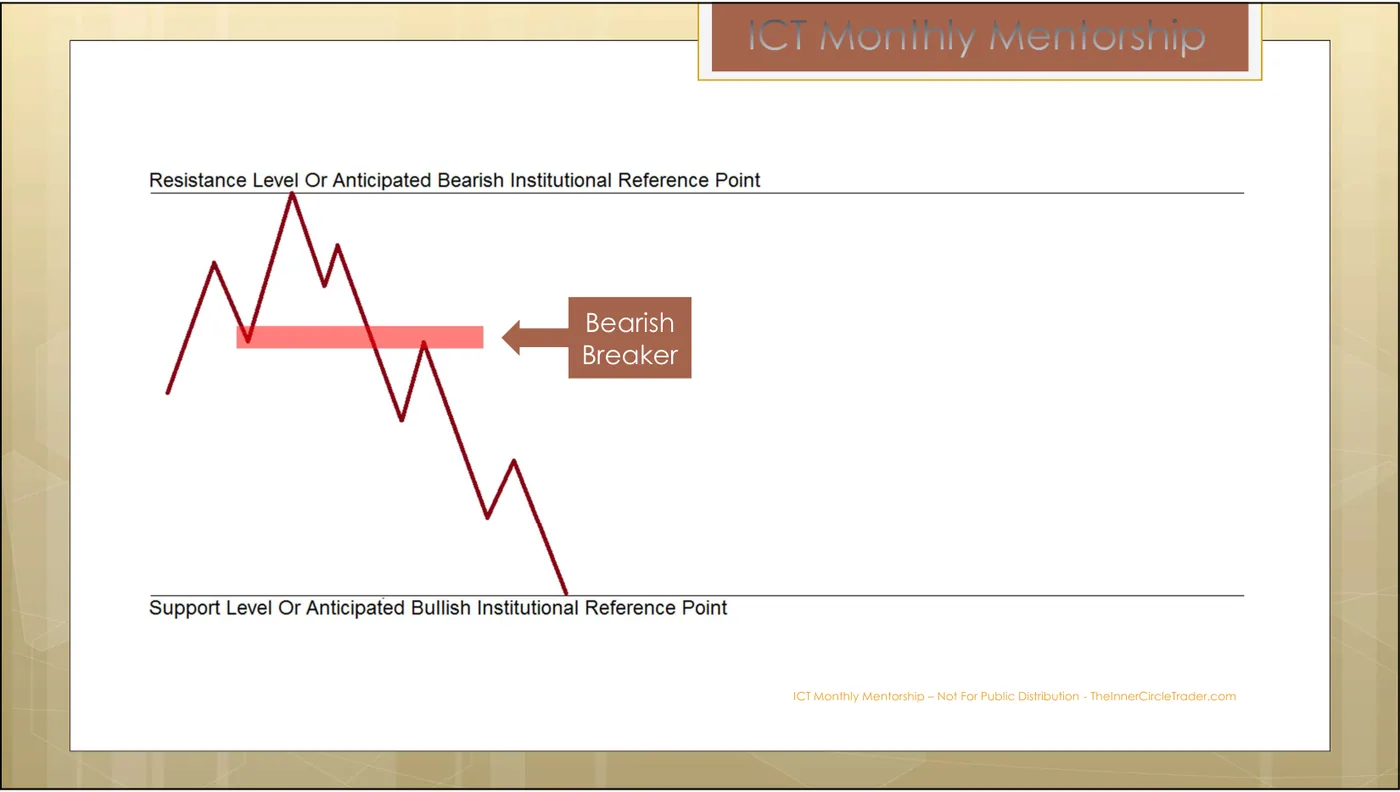
When Price Action Returns To The “A” Point Of Reference – The Long Positions Taken From “A” to “B” Price Swing Will Have An Opportunity To Liquidate Or “Mitigate” The Net Loss That Occurred When Price Dropped From “B” To “C”. This Can Result In New Lower Price Swings To “C” For Retesting. Or Significantly Lower Prices Into The Support Level Under Market Price.
Three points, in order:
- A — longs get in here, and price rallies.
- B — the high. Everyone from A is comfortable.
- C — price drops below A. Everyone from A is now underwater.
Return to A is where they get out flat. That exit is your entry, in the opposite direction, with risk defined above the swing.
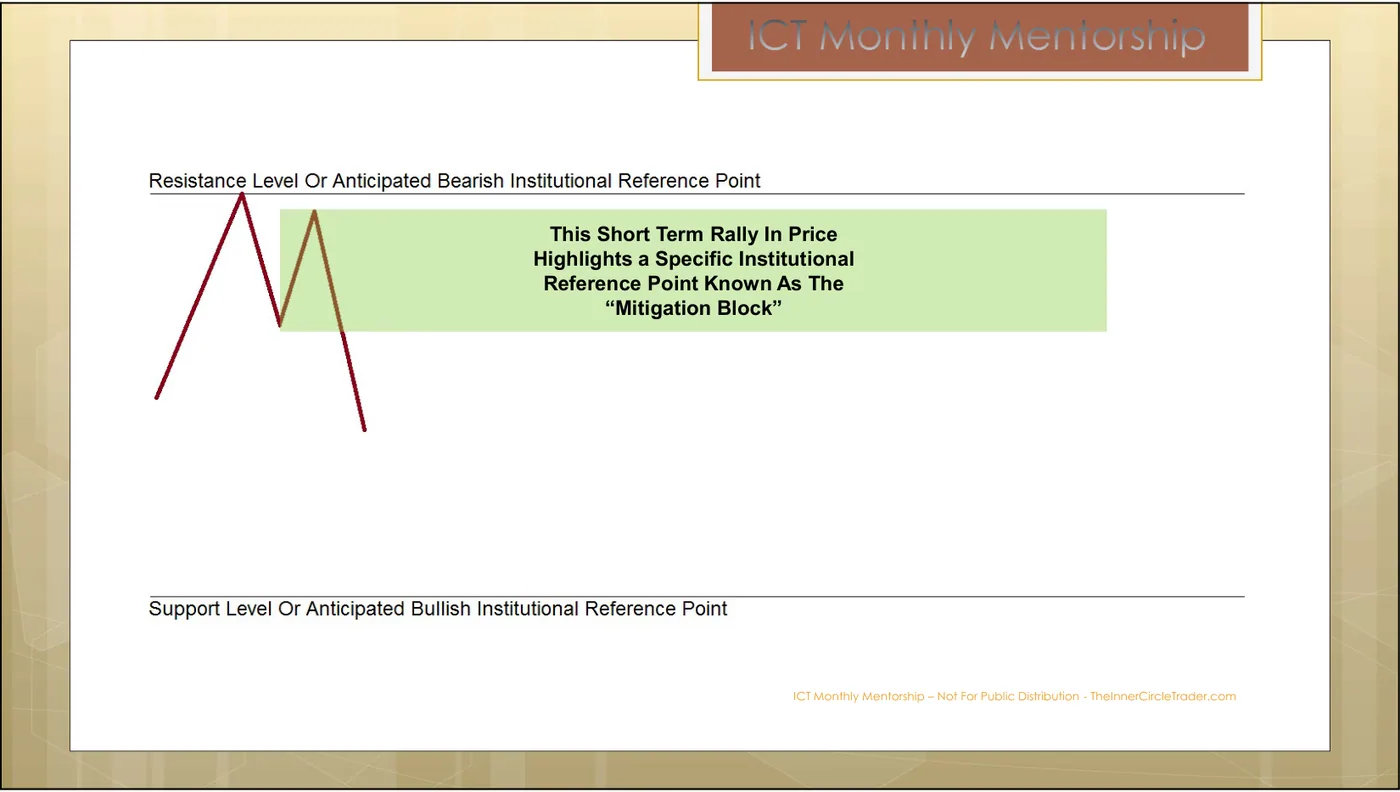
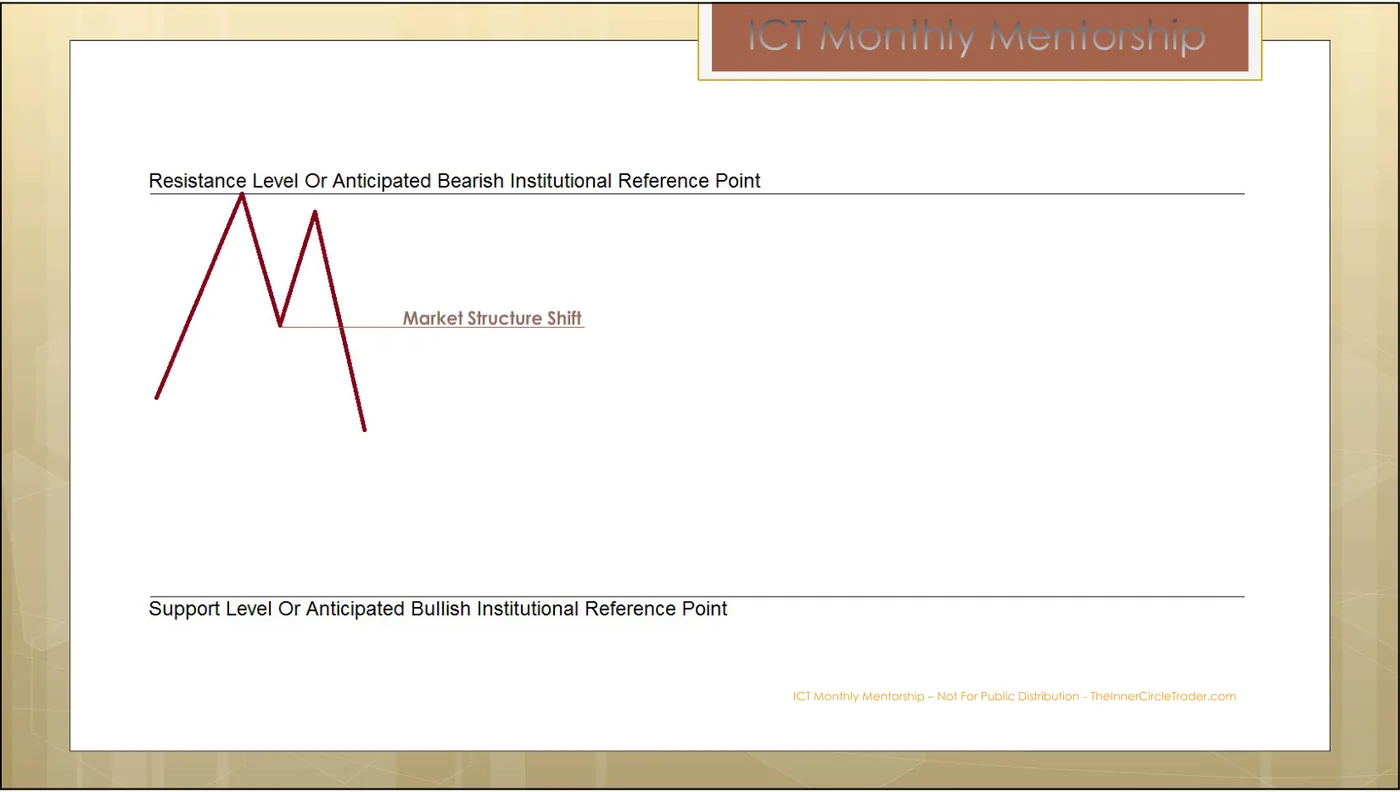
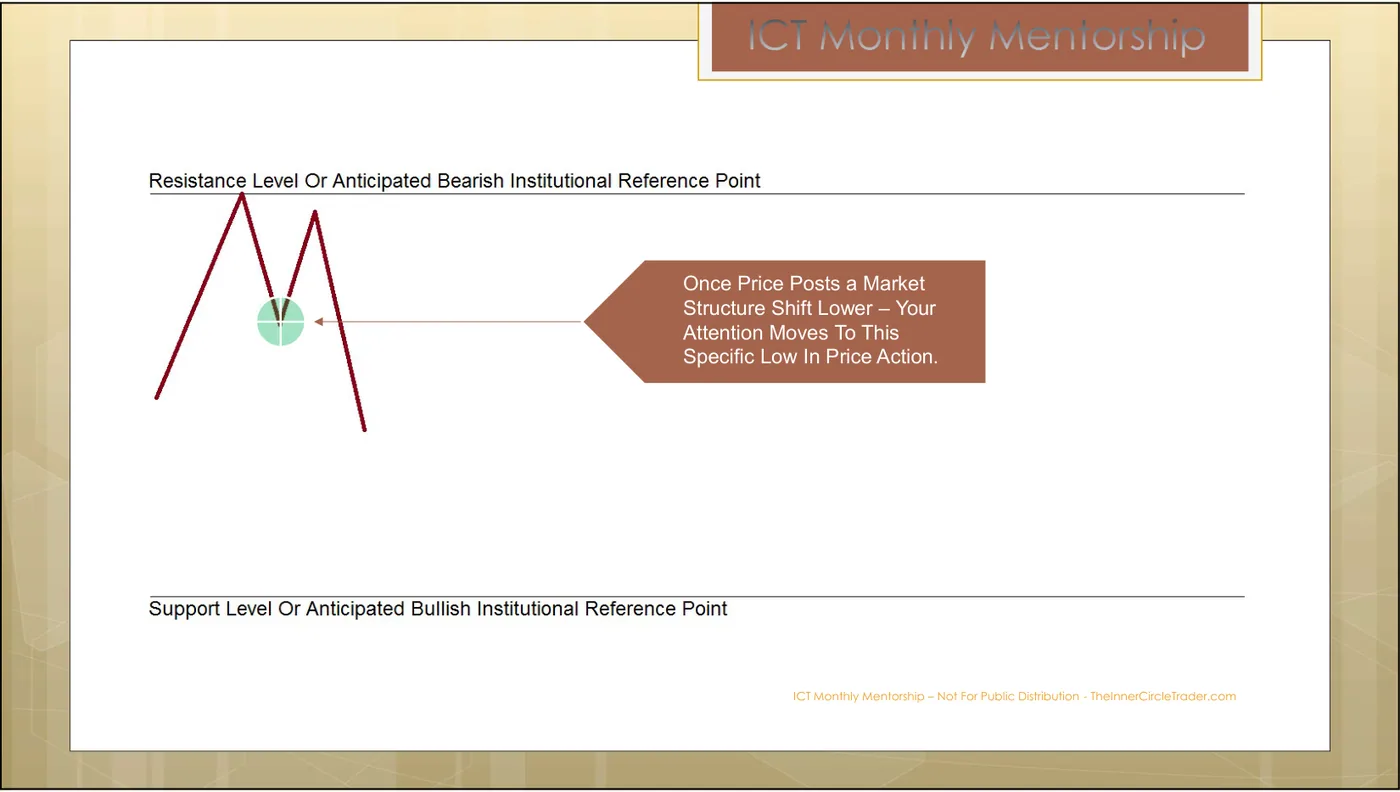
Note the trigger Month 4 attaches to it:
Once Price Posts a Market Structure Shift Lower – Your Attention Moves To This Specific Low In Price Action.
A clean schematic: price rallies, fails, and breaks lower. Before revealing: mark the level where traders are trapped, and say which direction you would be trading from it. Reveal shows ICT naming the object on the next slide.
The mitigation block is named. Before revealing: what has to happen structurally before this level becomes actionable, and how would you verify it using M3's count rather than by eye?
Moment two · The breaker block
Same mechanism, one extra event: a liquidity pool — the cluster of stop orders resting beyond an old high or low (M2) — gets run first.
Bearish Breaker Block is a bearish range or Down Close Candle in the most recent Swing Low prior to an Old High being violated. The Buyers that buy this Low and later see this same Swing Low violated – will look to mitigate the loss. When Price returns back to the Swing Low – this is a Bearish Trade Setup worth considering. Ideal Set Up: In Major To Intermediate Term Downtrends
Unpack the sequence, because the definition packs four events into one sentence:
- There is a swing low. People buy it.
- An old high above gets violated — a run on buy-side liquidity. M2’s mechanic, and the reason the whole thing happens.
- Price fails and comes back down through that swing low. The buyers from step 1 are now trapped.
- Price returns to the swing low. They exit. You sell into it.
The bullish mirror is stated on p.56:
Bullish Breaker Block is a bullish range or Up Close Candle in the most recent Swing High prior to an Old Low being violated. The Sellers that sold this Low and later see this same Swing High violated – will look to mitigate the loss. When Price returns back to the Swing High – this is a Bullish Trade Setup worth considering. Ideal Set Up: In Major To Intermediate Term Uptrends
Two clauses most retellings drop, and both matter:
“prior to an Old High being violated.” The breaker requires a stop run first. No run on liquidity, no breaker — you have a mitigation block at best.
“Ideal Set Up: In Major To Intermediate Term Downtrends.” He states the context. A breaker against the intermediate-term trend is not the ideal setup he describes, and the trend is countable from M3.
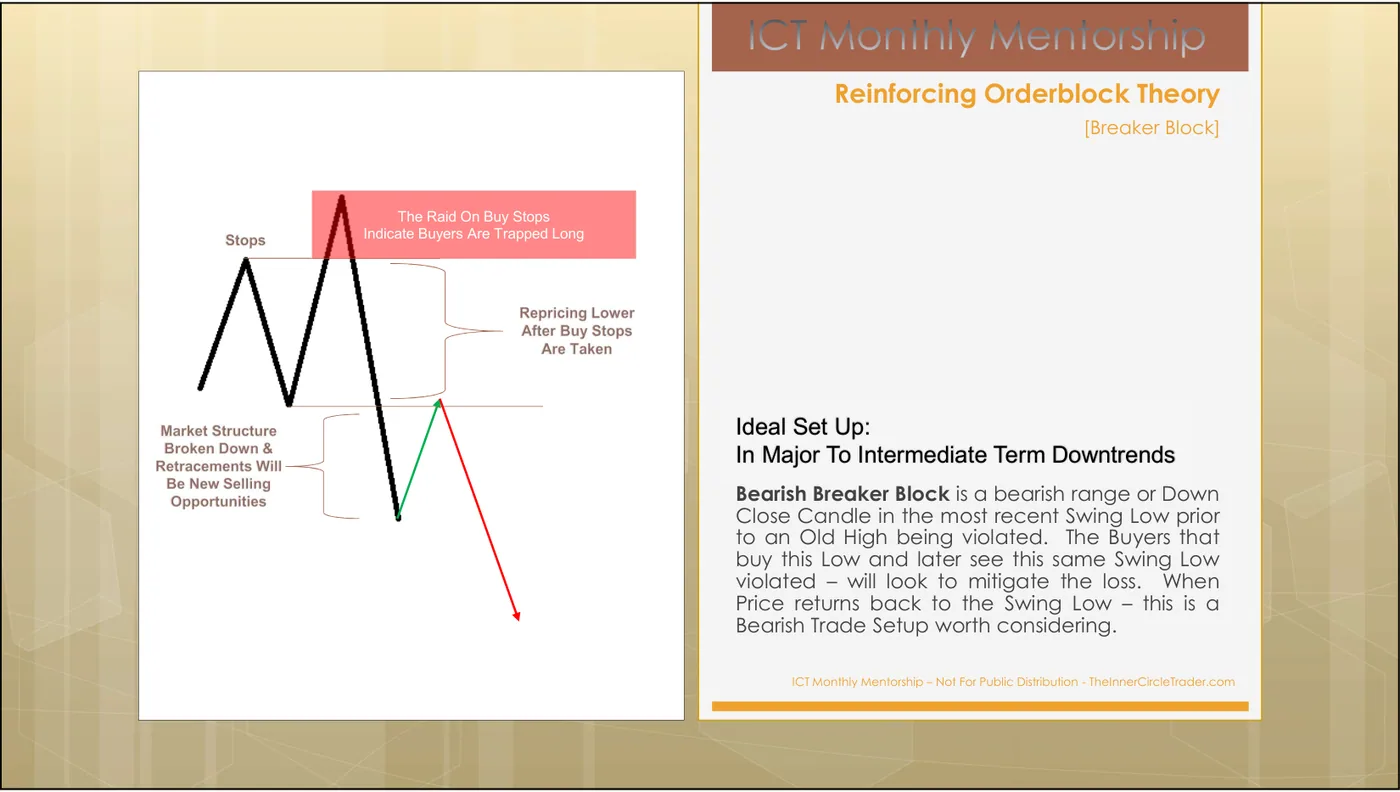
Put the bearish breaker sequence in order.
A bearish breaker is drawn on the schematic. Before revealing: state what event made these buyers trapped, and where their stops were before it happened.
Month 4 attaches 'Ideal Set Up: In Major To Intermediate Term Downtrends' to the bearish breaker. What does this course do with that clause?
Moment three · The rejection block
The fastest version. No structural break, no return over days — the trap and the release happen inside one or two candles, and the evidence is the wick.
Bearish Rejection Block is when a Price High has formed with long wicks on the high(s) of the candlestick(s) and Price reaches up above the body of the candle(s) to run Buy Side Liquidity out before Price Declines. Ideal Set Up: In Major To Intermediate Term Downtrends
Bullish Rejection Block is when a Price Low has formed with long wick(s) on the low(s) of the candlestick(s) and Price reaches down below the body of the candle(s) to run Sell Side Liquidity out before Price Rallies higher. Ideal Set Up: In Major To Intermediate Term Uptrends
The level is the body, not the wick. This is the practical detail that makes the rejection block usable: the wick shows you liquidity was run, and the body is the price you work from. Using the wick extreme as your level gives you an entry that is by definition at the worst price of the move.
ICT’s own slide header for this section names the classic pattern it corresponds to:
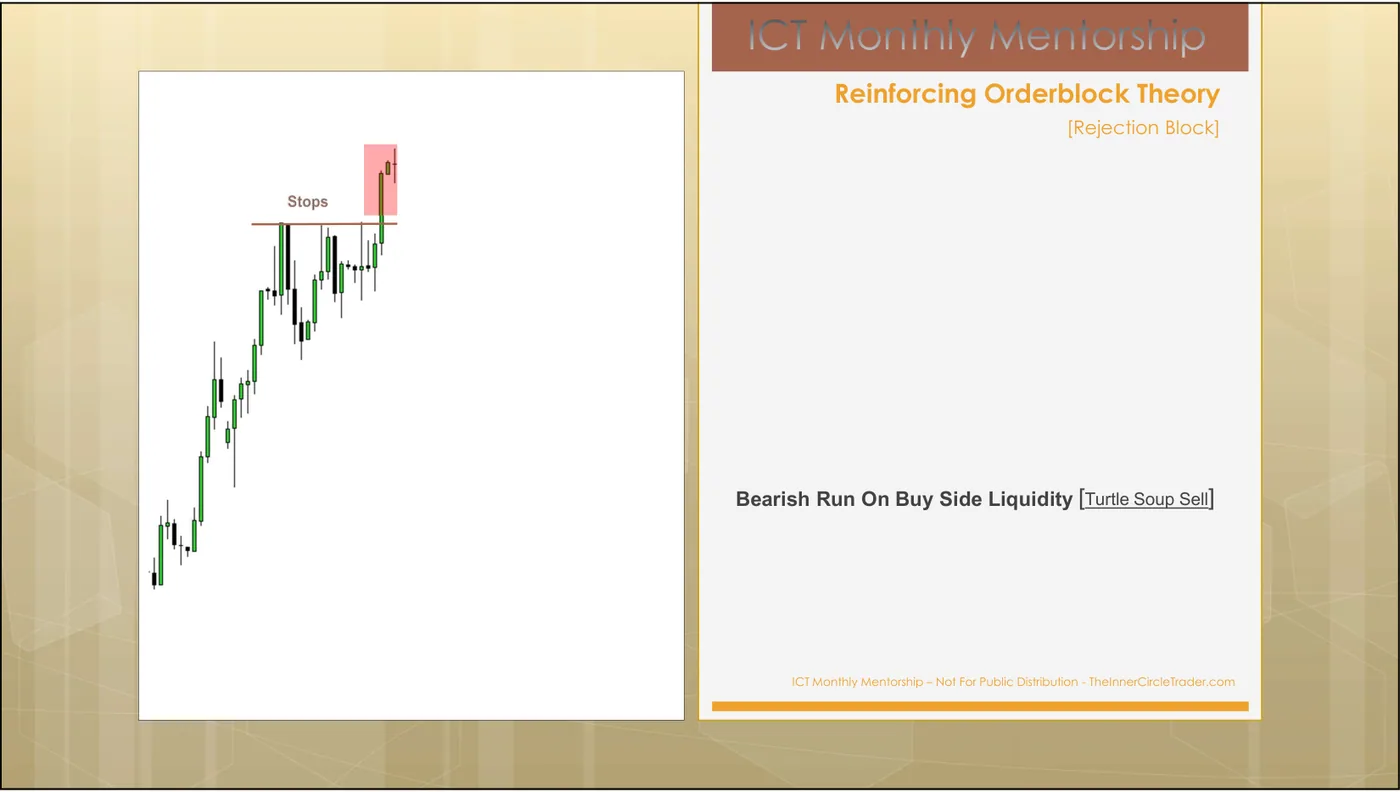
A daily candle spikes 40 pips above a clean old high and closes near its open, leaving a long upper wick. Where is the level?
ICT's rejection-block slides carry the header 'Bearish Run On Buy Side Liquidity [Turtle Soup Sell]'. What is that telling you?
Telling them apart
Same question, three moments. The clip plays all three side by side and ends on the one question that sorts them:
Transcript
- Mitigation: longs from A are trapped once price breaks below A. The return to A lets them out. No pool is needed.
- Breaker: the same trap, but a pool is run first. The swing low that held gets broken — its return is the trade.
- Rejection: trap and release inside one or two candles. The wick runs the pool — trade the body, never the wick.
- Ask first: was a liquidity pool run? Pool run, then the swing broke → breaker (level: the swing). No pool, a leg trapped people and price broke its origin → mitigation (level: point A). Pool run by the wick and rejected, no break → rejection (level: the body). Nobody trapped → none of them, no trade.
The same sort, as a checklist to use in this order:
| Was a liquidity pool run first? | Is there a structural break? | Timescale | Level you use | |
|---|---|---|---|---|
| Rejection block | Yes — by the wick, in-candle | No | 1–2 candles | The body of the wicked candle(s) |
| Mitigation block | Not required | Yes — price broke below A | Days | Point A, the origin of the trapped leg |
| Breaker block | Yes — old high/low violated | Yes — the swing that held got violated | Days | The swing low/high itself |
The fastest discriminator is the pool. Ask first: was a liquidity pool taken before this structure broke?
- Taken, and then the swing that supported the move got violated → breaker.
- Not taken, price just failed and broke a level that had trapped people → mitigation block.
- Taken and rejected inside the candle, with no structural break at all → rejection block.
And a fourth answer that is always available: none of these. A level that trapped nobody is not any of the three, however much it looks like a zone.
Price ran an old low, failed to continue, then rallied back through the swing high that had capped the previous decline. Price is now returning to that swing high. Which object is it?
Price broke below a small consolidation that had formed over four candles with almost no participation, and is now returning to it. Which of the three applies?
Which statements about the three objects are true? (Select all that apply.)
Why this module is worth its difficulty
Look at what you now have. Every object in Tier 2 is one of two kinds:
- Where business was done and left residue — order block, fair value gap, liquidity void.
- Where somebody is trapped and needs out — breaker, mitigation, rejection.
Six named objects, two mechanisms, and both of them are answers to “who is on the other side of my fill?” That question has one answer in this method, and it is never “the market”. It is always a specific group of participants with a specific reason to transact at a specific price.
M8 takes those six objects, adds the old high/low, ranks all seven, and tells you which one to use. You are one module away from the selection rule.
Sort the six Tier 2 objects by mechanism.
The decision rule
- When
- A structure you were watching has broken, or a level has been wicked through and rejected, and price is now returning to it.
- Then
- Ask one question — who is trapped, and is this the price that lets them out? If a pool was run before the break, you have a breaker: trade the return to the violated swing. If no pool was run but a leg was trapped, you have a mitigation block: trade the return to its origin. If the trap and the rejection happened inside the candles, you have a rejection block: trade the body, never the wick.
- Otherwise
- If nobody is trapped, none of the three applies, whatever the shape looks like. And if the setup is against the major-to-intermediate-term trend, it is not the ideal setup his own slides describe — so it needs a better reason than usual, or no trade.
Done with M7?
Mark it complete only if you could teach the decision rule to someone else without scrolling back up. Completion is stored in this browser.