Entry Refinement: OTE & the Fib Toolkit
The 62 / 70.5 / 79% band, extensions as targets, and when OTE does not apply.
“Entry is refinement, not decision. The decision was made three modules ago.”
The decision was made three modules ago
By the time you draw a fib, everything that matters has already been settled. M10 decided the direction and the level. M8 decided which array. M9 decided the window. What is left is a much smaller question:
Given that I am buying this array, what price do I pay, and where does that put my stop?
That is refinement. It changes your R; it does not change whether the trade exists. Your own library is blunter about it than most people are comfortable with:
The least important process in trading is the entry signal.
OTE, precisely
The Optimal Trade Entry (OTE) is a retracement band on a completed price swing: after a move up, the zone between 62% and 79% of the way back down is where you look to buy. (Mirror everything for a short.)
It is a rule of thumb to use the 127% and 162% Fibonacci levels for profit taking. Entries are found in the optimal trade entry between the 62% retracement and 79% retracement.
Trading on Fibonacci levels alone is not advised, look for something to line up with it.
Three numbers inside the band, all of which your library uses as limit-order prices:
- Use optimal trade entry on lower time frames around key S/R.
- Ideally enter in major session opening [London Open or New York Open].
- Use limit orders at 62%, 70.5%, and 79% Fibonacci levels.
| Level | What it is | When it is the one you use |
|---|---|---|
| 62% | The shallow edge of the band | You want to be filled; the retracement may not go deeper. With high-impact news due, ICT’s own preference is the 62% plus the spread (Smart Money Swing Trading Webinar). |
| 70.5% | The middle — the “sweet spot” | The default when nothing argues for either edge. |
| 79% | The deep edge | The best price and the tightest stop, at the cost of not being filled at all. |
| 127% / 162% | Extensions of the same swing — levels beyond the swing’s end | Profit taking, not entry. |
And the instruction that matters more than any of them:
Do not try to get the very best entry price. Try to get in between the 62% retracement and the sweet spot OTE.
Do not try to exit on the high or low.
Always factor in the spread plus 2-3 pips.
Where is the Optimal Trade Entry band, and what are the 127% and 162% levels for?
"Do not try to get the very best entry price. Try to get in between the 62% retracement and the sweet spot OTE." What is the cost of always waiting for 79%?
Drawing it: which swing?
This is where OTE actually goes wrong, and it is not a fib problem — it is an M3 problem wearing a fib.
The swing you measure is the one that produced the move you are trading against. For a long: from the swing low that started the rally, to the swing high that ended it. Both points must be swing points by M3’s three-candle definition, not “where the chart looks like it turned”.
A swing point is a simple 5 bar [candle] formation.
A swing high is any bar with 2 lower highs on both sides of it.
A swing low is any bar with 2 higher lows on both sides of it.
Two practical rules from your own material:
The daily highs and lows are excellent reference points to pull the Fibonacci tool on.
Trading on Fibonacci levels alone is not advised, look for something to line up with it. Accept a maximum of 15 pips apart when looking for confluences.
Fifteen pips. That is your library’s own tolerance for what counts as confluence, and it is a useful discipline: if the OTE band and the order block are forty pips apart, they are two different levels and you are choosing one, not combining them.
Your OTE band keeps landing in places that do not work. What is the most likely cause?
Confluence is the setup; the fib alone is not
What qualifies an optimal trade entry? Price has to make it back to an order block.
That one line collapses this module into Tier 2. The fib is a measuring device for locating where inside the array to place the limit — it is not the reason for the trade. Which gives the order of operations:
- The array is the reason. From the matrix, from the cascade, in the right half of the range.
- The fib is the ruler. Draw it on the swing that produced the move.
- The overlap is the entry. Where the 62–79% band crosses the array. ICT’s own fine-tuning combines the top of the order block, the sweet spot and round numbers (Finding Opportunities in FX Now).
- The stop is structural. Beyond the array, not at a fib level.
All four steps, in the order you do them:
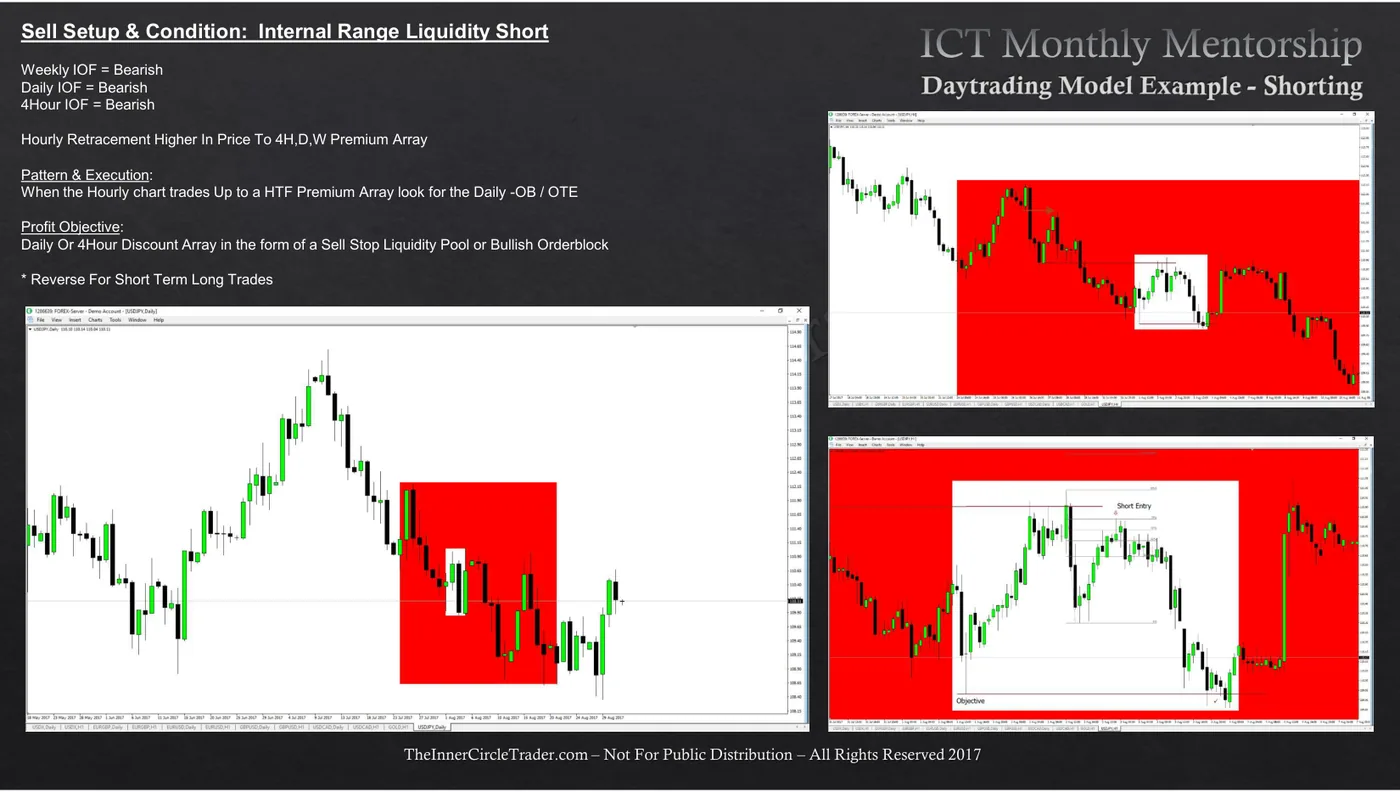
Pattern & Execution: When the Hourly chart trades Up to a HTF Premium Array look for the Daily -OB / OTE
Read the slash. Order block or OTE — they are two ways of pricing the same entry inside the same array, and the model treats them as interchangeable. Which is exactly why you should pick one and stop switching.
"What qualifies an optimal trade entry? Price has to make it back to an order block." What does that single line do to this module?
Your OTE band sits forty pips away from the bullish order block you wanted to buy. What does your library's own tolerance say?
When OTE does not apply
Four cases, all of which show up regularly:
- There is no clean swing to measure. In a range with overlapping structure, any fib is arbitrary and the band lands wherever you chose to anchor it.
- The retracement never reaches 62%. The limit does not fill. That is the entry method working as designed — a shallow retracement means the move left without you, and chasing it is a different trade with a different stop.
- The band and the array do not overlap. More than about fifteen pips apart and there is no confluence, only two levels.
- The 3:1 arithmetic fails from the band. If the distance from a 79% fill to the target array is not three times the distance to your structural stop, the setup dies here. Improving the entry to manufacture the ratio is the failure M13 is built to stop.
And the exit rule that belongs with the entry:
If price trades significantly below the 79% retracement level then you should be looking to close the trade out. There is no need to let it get to your stop in this scenario. You can always look for another opportunity to get in the trade that has a better optimal trade entry.
Select every case where OTE does not apply. (More than one.)
You are long from the OTE band and price trades significantly below the 79% level, but your stop is further down, beyond the array. What does your library suggest?
The honest note: two entry models, one lineage
Your library’s classic entry is the OTE band on a retracement. The mechanical
strategy in STRATEGY_DELIVERABLE.md uses a different one — the mean threshold
of a fair value gap.
Both descend from this material. Neither has been measured against the other anywhere in your library or in this course, and no basis exists here for claiming one is better.
The OTE band and the FVG mean threshold are two entry models from the same lineage. What does this course say about choosing?
The decision rule
- When
- You have a valid array in the correct half of the range, an HTF bias, and a window — and price is retracing toward it.
- Then
- Draw the fib on the swing that produced the move, low to high for a long. Place a limit order where the 62–79% band overlaps the array — 70.5% as the default, 62% if you need the fill, 79% for the tightest stop. Stop goes beyond the array, never at a fib level. Targets at the opposite-half array; the 127% and 162% extensions are the scaling points on the way.
- Otherwise
- No clean swing to measure, no overlap within about fifteen pips, retracement never reaches 62%, or the arithmetic from the band to the target array does not clear 3:1 — no trade. Do not improve the entry to make the ratio work, and if price trades significantly beyond 79% against you, close it rather than wait for the stop.
Homework
Place the fib before the retracement, not after it
Set the replay up
- Find a completed swing leg in replay — a clear low to a clear high, or the reverse.
- Stop the replay at the moment the leg completes, before any retracement.
- Draw the fib from the swing low to the swing high (for a long) with 0.62, 0.705, 0.79, 1.27 and 1.62 levels shown.
Then, bar by bar
- Write down your intended entry (a price in the 62–79% band), your stop, and your first target at the 127%.
- Compute the reward-to-risk BEFORE stepping forward. If it is under 3:1, write NO TRADE and stop — that is the correct outcome and it counts.
- Step the replay forward bar by bar.
- Record: did price reach the band at all? Which level inside it? Did it hold?
- Record where it went afterwards relative to the 127% and 162%.
Self-assessment — tick only what is honestly true
Done with M12?
Mark it complete only if you could teach the decision rule to someone else without scrolling back up. Completion is stored in this browser.