Liquidity: Why Price Moves At All
Stops as fuel. Buy-side and sell-side liquidity, external range liquidity as the destination and internal range liquidity as the route.
“Price isn't going up. It's going to get something. Every chart has a destination and I can usually name it before the move.”
Price does not go up. It goes to get something.
M1 gave you the reversal phase and left a hole in it: “the Market Makers have ran a level of Stops.” Ran what? Whose stops? Why there?
This module fills that hole, and it is the one that changes how a chart looks permanently. The likely way you have been reading liquidity is as a shape — a wick through a high means a sweep, a sweep means enter. Your library never frames it that way. It frames it causally: resting orders are the reason a large participant can transact at all, so price is routed to where those orders sit.
Once you hold that, every chart acquires a destination, and you can usually name it before the move happens. That is the difference between recognising a pattern after the fact and having a bias.
What liquidity actually is
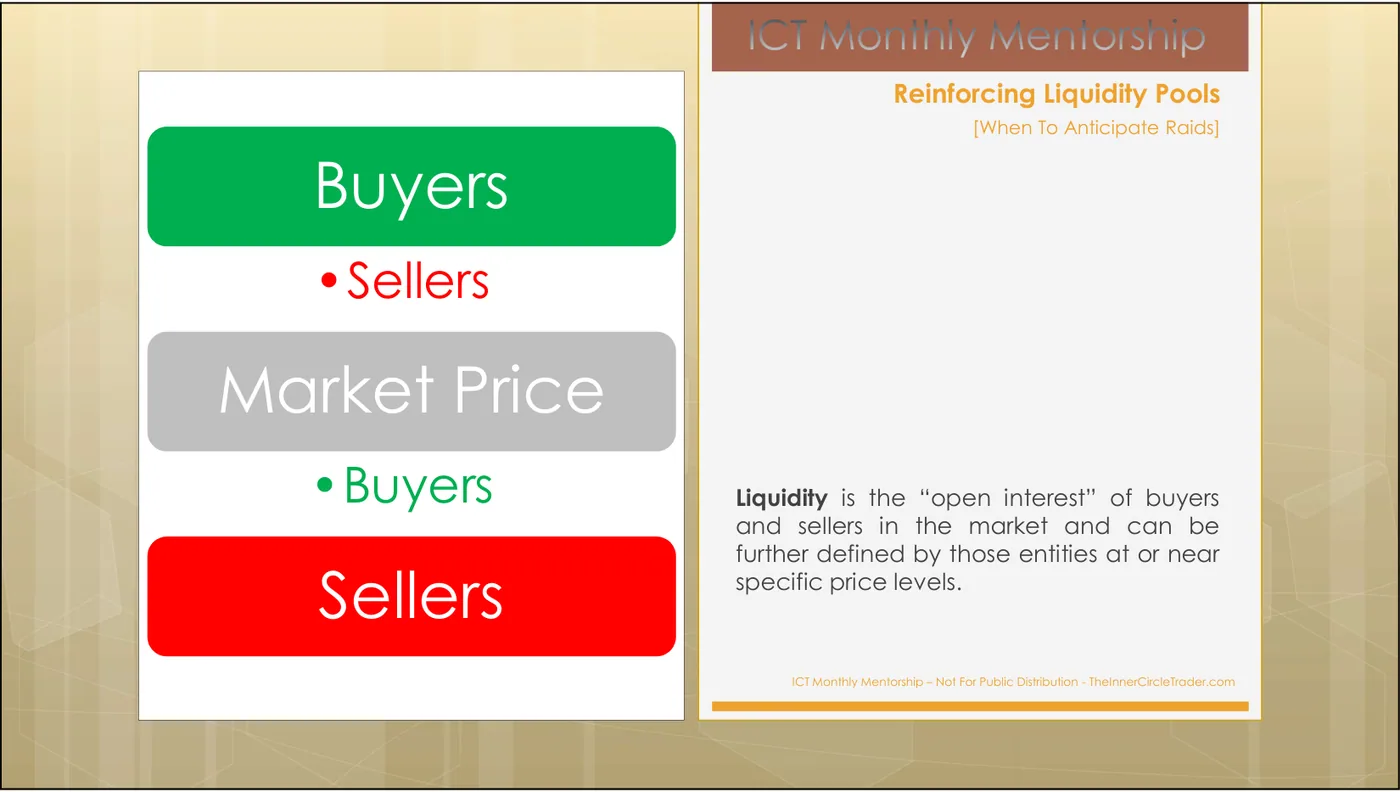
Liquidity is the “open interest” of buyers and sellers in the market and can be further defined by those entities at or near specific price levels.
Not volume. Not a zone. Open interest — orders that exist and have not yet been filled. That is a claim about the order book, and it has a consequence that sounds obvious and is not: to fill a large buy order you need a large supply of sell orders, and those are found in exactly one place — under an old low, where every long has trailed a stop and every breakout seller has parked one.
The four lines that name every pool
Month 1 already gave you the vocabulary. Read it again now that you know what it is for.
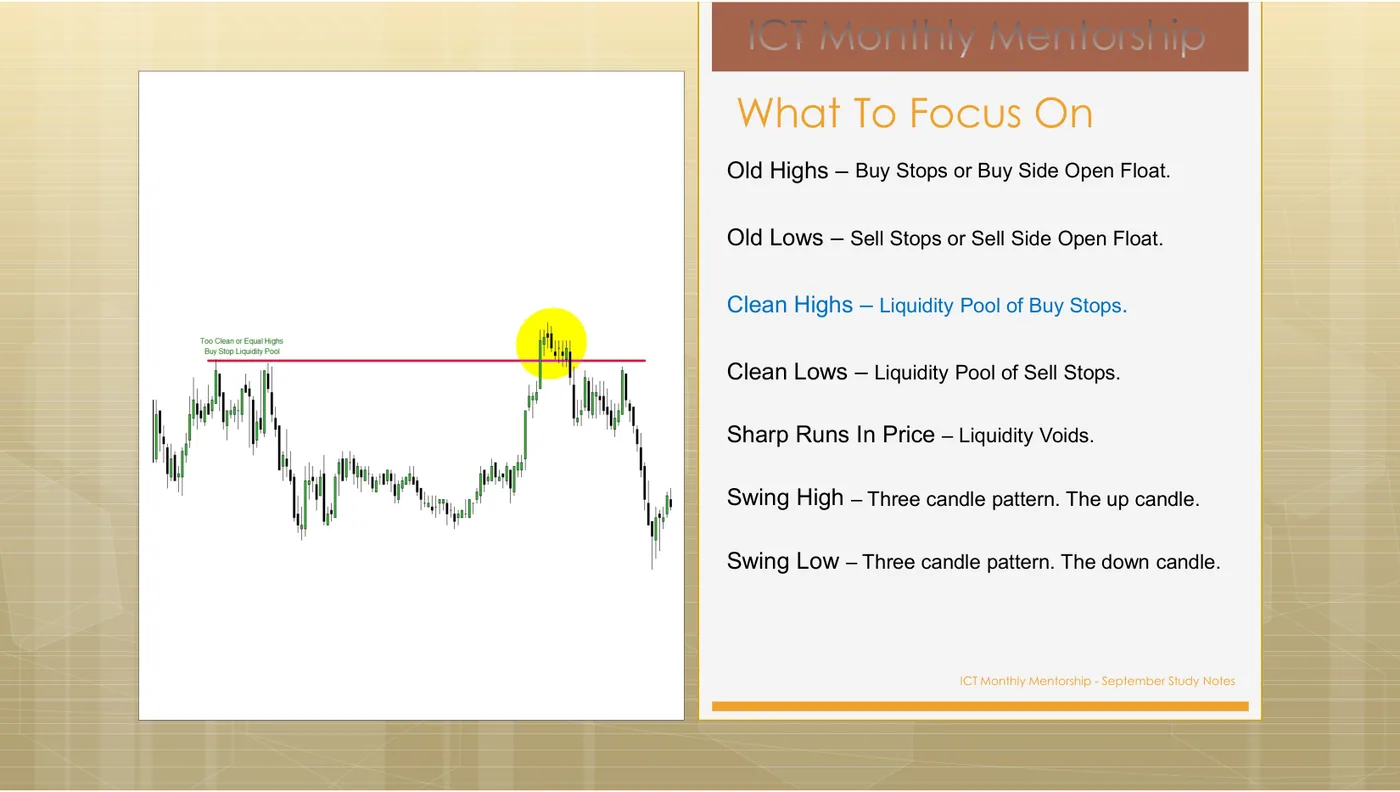
Old Highs – Buy Stops or Buy Side Open Float. Old Lows – Sell Stops or Sell Side Open Float. Clean Highs – Liquidity Pool of Buy Stops. Clean Lows – Liquidity Pool of Sell Stops.
Two distinctions are doing work here.
Old vs. clean. An old high is any prior high — there are stops above it. A clean high is a high with no mess around it: equal highs, a flat top, an obvious level everybody can see. Clean means the pool is dense, because everyone drew the same line. Density is what makes a level worth travelling to.
Stops vs. open float. Stops are protective orders from people already positioned. Open float is resting breakout orders from people who are not. Both become market orders at the same price. That is why a level everyone is watching is a target rather than a barrier.
The causal sentence
This is the paragraph that turns liquidity from a noun into a mechanism. It is worth reading twice.
Definition - The Low that is Under the current market price action will typically have Trailed Sell Stops under it on Long Traders. Or Sell Stops for Traders who wish to Trade a Breakout Lower in Price for a Short Position. Validation: When the Low is Violated or Price moves below the recent Low – the Sell Stops become Market Orders to Sell At Market. This injects Sell Side Liquidity into the Market – typically paired with Smart Money Buyers. Entry Techniques: When underlying is Bullish. Before Price trades Under the recent Low – place a Buy Limit Order just below or at the recent Low. You are Buying the Sell Stops like a Bank Trader or any other “Smart Money” entity would. Defining Risk: The Low you are Buying Under – can see a swing of 10 to 20 pips in most cases. A 30 to 50 pip stop is ideal if your entry is Under the Low and not above it – fearing a missed entry.
Four things to extract, in order of how much they will change your trading.
1. “The Sell Stops become Market Orders to Sell At Market.” This is the entire causal claim of the method. Stops are not a risk-management detail; they are the supply. A run on a low manufactures sellers, and someone is on the other side of them.
2. There is a validation condition. The low must actually be violated. Price approaching a low is not a run on the pool. This matters because it is a checkable, binary event — it either happened or it did not — and half of the “liquidity grab” entries people take are before the fact.
3. The entry is a limit order placed before the run, under the low. Read that again if you have spent years waiting for a candle to close back inside. This is his classic model and it is uncomfortable: you are buying into a declining market at a price you know may print. M12 covers the alternative — the OTE entry after the run — and M14 makes you pick one and stop switching.
4. The final clause is about you. “…if your entry is Under the Low and not above it – fearing a missed entry.” He names the psychological failure in the risk section: the trader who moves the entry up to avoid missing it gets a worse price and a worse stop.
On screen is ICT's structural picture of where orders rest: buyers above, sellers below, market price between. Before revealing: on your own chart, mark the nearest old low, and state what specifically is sitting under it and what happens the instant it is violated. Reveal shows the next slide — the same idea with his own annotated chart and the full Run On Liquidity Pool definition.
The decomposition that makes this usable
Knowing “price seeks liquidity” is not yet actionable, because every chart has pools in both directions. Month 4 splits liquidity into two categories, and the split is the practical core of this module.
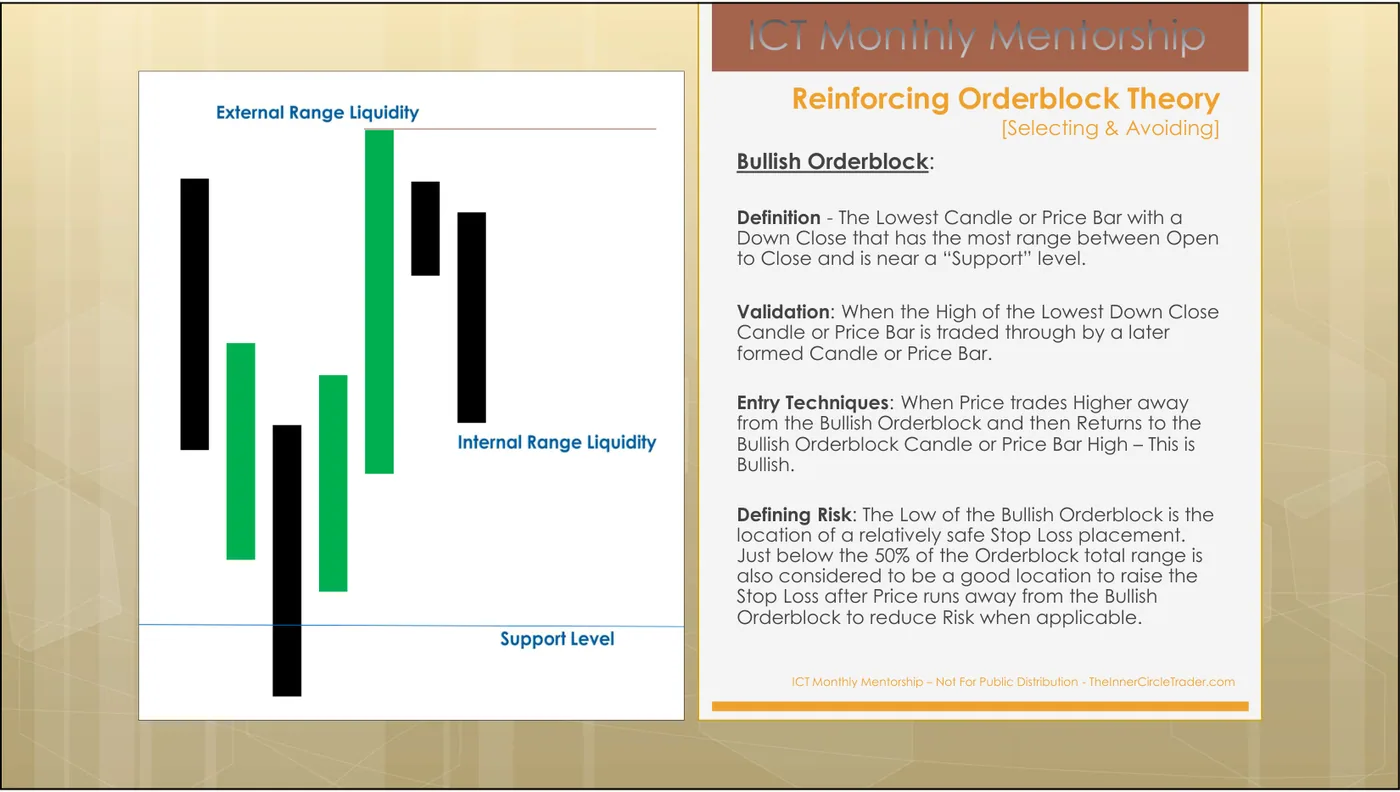
A. External Range Liquidity 1) The current trading range will have Buy Side Liquidity above the range or High. 2) The current trading range will have Sell Side Liquidity below the range or Low. 3) Runs on Liquidity – seek to pair orders with the pending order liquidity – Liquidity Pools. 4) External Range Liquidity Runs can be Low Resistance or High Resistance in nature.
B. Internal Range Liquidity 1) When current trading range is likely to remain – Liquidity Voids will fill in – Gap Risk. 2) When current trading range is likely to remain – Fair Value Gaps will fill in – Gap Risk. 3) Orderblocks inside the trading range will be populated with new Buy & Sell orders. 4) Market Maker Buy & Sell Models will form inside trading ranges.
| External range liquidity | Internal range liquidity | |
|---|---|---|
| Where | Outside the range — above the high, below the low | Inside the range |
| What | Buy stops, sell stops, breakout orders | Fair value gaps, liquidity voids, order blocks |
| Role | The destination | The route |
| You use it for | Targets, and for reading intent | Entries, and for reading the path |
This is the sentence to memorise: external liquidity is where price is going; internal liquidity is what it touches on the way.
That single distinction resolves the most common confusion in self-taught SMC trading — treating an FVG as a target and an old high as an entry, which is exactly backwards. Fair value gaps are stations. Old highs and lows are destinations.
You have a 4-hour range. Inside it sits an untouched fair value gap; above the range high are three weeks of equal highs. Which is the destination and which is the route?
Which of these are internal range liquidity? (Select all that apply.)
Low resistance vs. high resistance
Not every run is worth taking. Month 1 gives the filter, and it is the closest thing in your library to a definition of “high probability”.
When Price has little resistance in it’s way to run an area of Liquidity. This is classically seen just under an Old High or above an Old Low. Price will surge sharply and typically on the release of an economic news release. High Probability setups are framed on the premise the market will have very little resistance in its path to run into obvious Liquidity Pools.
So the question is not only where is the fuel but what is between price and it. A run into an obvious pool with clear air in front of it is the setup. A run into the same pool with three untouched order blocks and a 4-hour gap in the way is not — that is a high-resistance run, and it will stall in the middle of your trade.
This is the first genuine filter the course gives you, and it is available before you know a single array by name: look at the space between price and the pool. Is it empty, or is it furnished?
Price is 40 pips below a set of clean equal highs. Between here and there sit an untouched 4-hour bearish order block and an unfilled fair value gap. How does Month 1's low-resistance framing read this?
You mark a range. Above it, the highs are ragged and staggered over three weeks; below it, there is a single flat double-bottom from Monday. Where is the denser pool, and what does that give you?
The footprint: liquidity voids
When a run does happen, it leaves evidence.
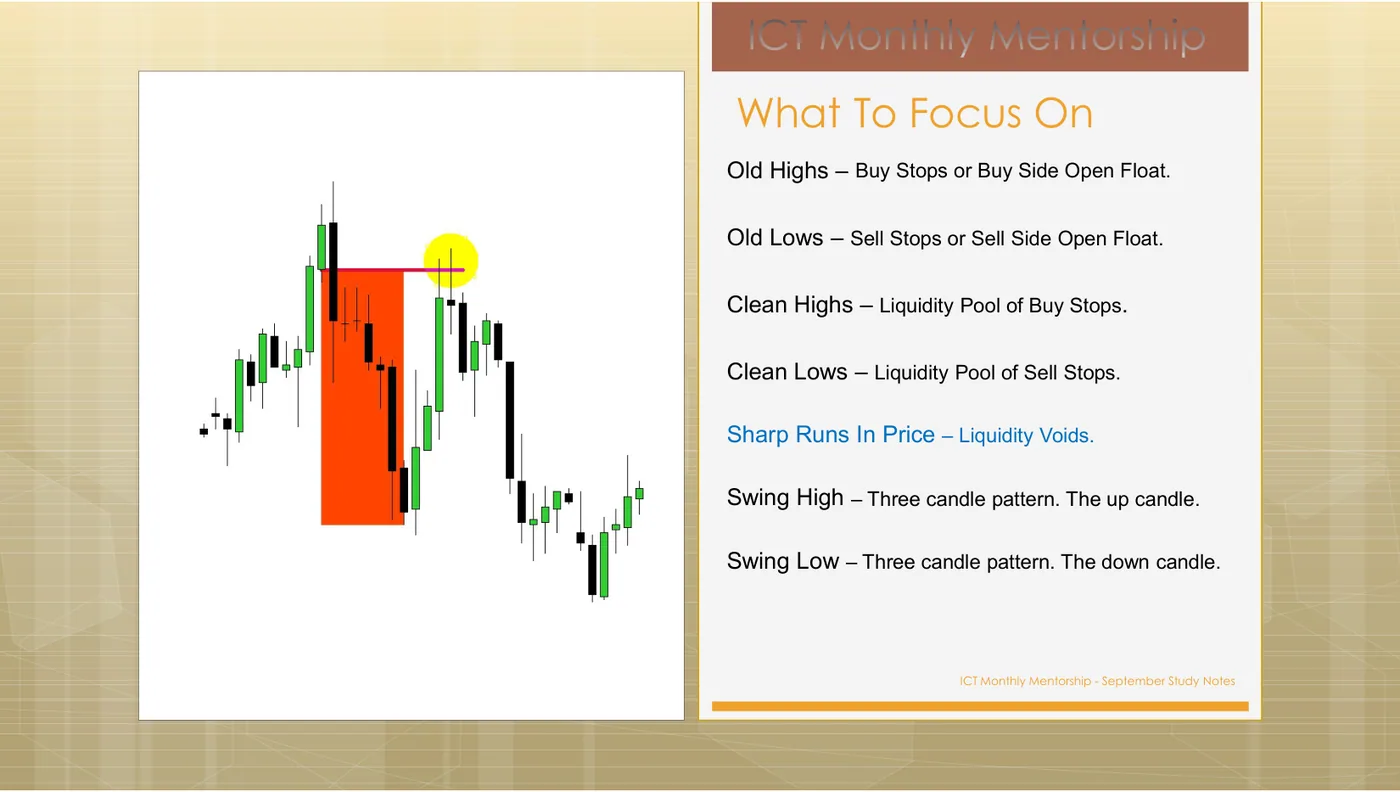
After a sharp run in Price, the large candles that form are the least efficiently trades in the range. Sudden runs in Price will leave porous Price Action that tends to fill in at a later time. This is described as a void of market liquidity or Liquidity Void.
The void is not a signal. It is a record of where trade did not happen, and “tends to fill in at a later time” is a statement about unfinished business. It is internal range liquidity — a station, not a destination — and M6 makes the distinction between it and the fair value gap precise.
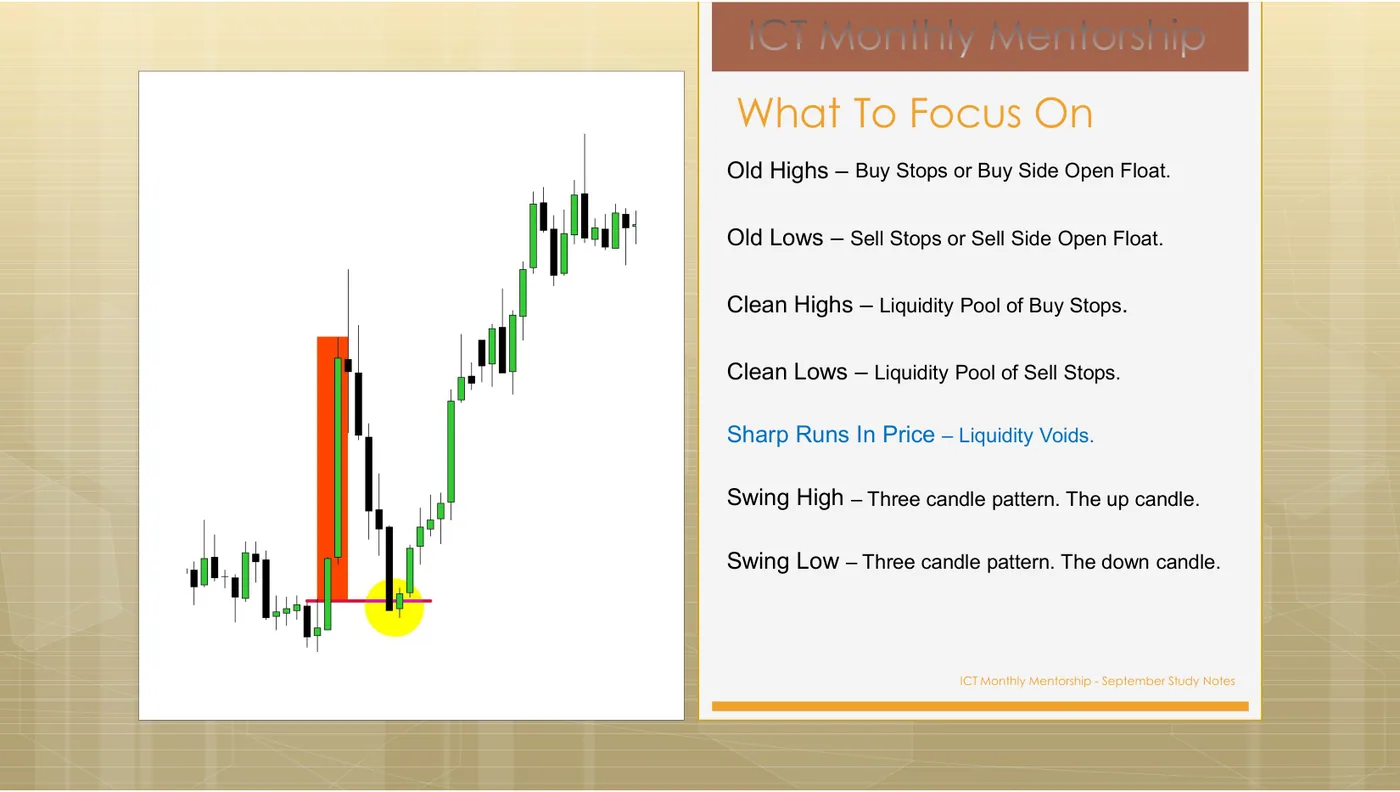
A sharp run leaves a record of itself. On screen is a chart with the run marked. Before revealing the next slide: state whether the marked area is a destination or a route, and what you would use it for. Reveal shows ICT's next example in the same sequence.
Naming the destination: the actual skill
Here is the routine this module is trying to install. It takes about thirty seconds per chart and it is the most valuable habit in Tier 1.
- Mark the range you are working in. The most recent obvious high and low on your framing timeframe.
- Name both pools. Buy-side above the high, sell-side below the low. Say which one is cleaner — flatter, more equal highs or lows, more obvious.
- Look at the space in between. Empty in one direction and furnished in the other? That asymmetry is your bias, and it is a real one, derived from structure rather than from feeling.
- State the destination in a sentence. “I think this is going for the buy stops above Tuesday’s high, and there is nothing in the way.” If you cannot finish that sentence, you do not have a bias — which is a result, not a failure.
Price wicks through an obvious old high by 6 pips and closes back below it. What has your library actually told you?
How does this module change the order of operations from M1?
You run the destination routine on a chart. The nearest external pool in either direction is 300 pips away, and both paths are cluttered with untouched arrays. What is the output?
Where this connects
Everything downstream is an elaboration of this module:
- M4 decides which half of the range you are allowed to shop in — but the range is defined by the pools you just learned to mark.
- M5–M7 name the objects inside the range. All of them are internal range liquidity. All of them are stations on a route whose destination is external.
- M8 ranks them, and the ranking is only meaningful because you know where price is trying to get to.
- M9 tells you when the run happens, which on a swing horizon is mostly a question of which day of the week.
Why does the external/internal split matter for the reward-to-risk arithmetic you will meet in M13?
The decision rule
- When
- You have labelled the phase (DR-1) and are about to consider a trade.
- Then
- Before anything else, write one sentence naming the liquidity pool price is travelling to and stating whether the path is clear. Example: “Going for the buy stops above last week's high; nothing between here and there.” Only then look for an entry, and only in the direction of that sentence.
- Otherwise
- If you cannot name a specific pool, or the path to it is furnished with untouched arrays, you have no bias. Do not trade the chart. A high-resistance run is not a slower version of a good setup — it is a different, worse setup.
Done with M2?
Mark it complete only if you could teach the decision rule to someone else without scrolling back up. Completion is stored in this browser.